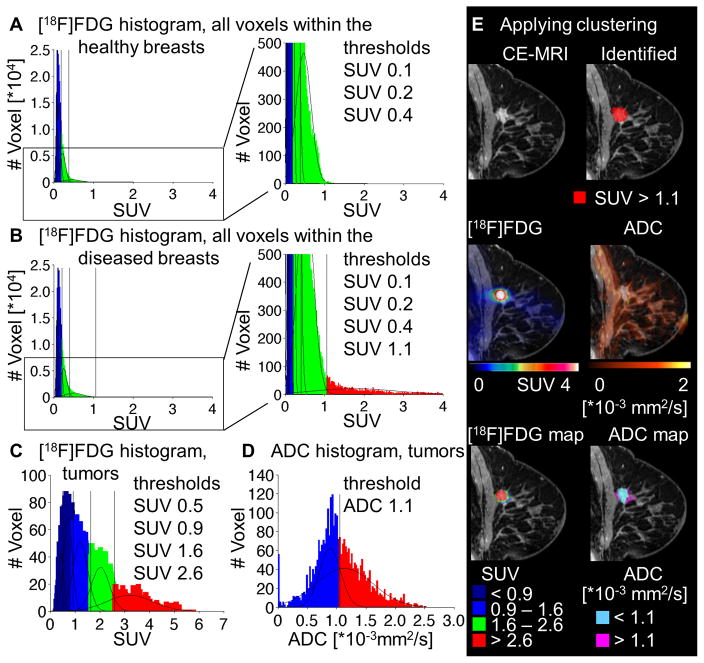
Figure 5.
Voxelwise analysis approach for clinical [18F]FDG-PET and DW-MRI: voxel data of the healthy (A) and diseased (B) breast were analyzed by the GMM approach for [18F]FDG. The best fits were identified for a sum of 4 (A) and 5 (B) Gaussian distributions, respectively. For intratumoral clustering, voxels within all tumors were fitted for [18F]FDG with a best fit of 5 Gaussian distributions (C) and ADC with a best fit of 2 Gaussian distributions (D). A representative tumor (E): CE-MRI as well as the parametric color maps produced for the whole breast approach for [18F]FDG, applying the threshold of 1.1 in SUV (first row); ADC and PET data (second row) and the parametric maps for the intratumoral clustering for [18F]FDG and ADC (third row).

