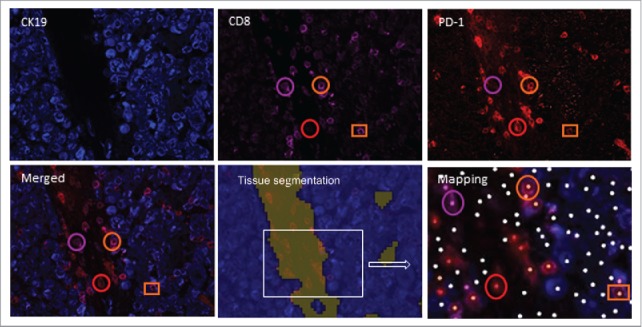
Figure 1.

Infiltration of PD-1+CD8+ T cells and CD8+ T cells in the tumor nest and stroma of a lung cancer patient. Frozen tissue sections were stained with antibodies to detect PD-1, CD8 and CK19. Using InForm® software, tissue segmentation was performed on the basis of CK19 staining to determine tumor nest (blue) and stromal areas (other color). Circles identify cells in the stroma and squares identify the presence of cells in the tumor nest. A phenotyping procedure based on “training” of the software to recognize positive and negative cells was performed. Mapping determined the phenotype of the cells (PD-1+CD8+: orange dot; PD-1−CD8+: pink dot, PD-1+CD8−: red dot, other cells: white dot) and allowed automated counting. For example, orange circles identify PD-1+CD8+ stromal cells, while pink circles identify PD-1−CD8+ cells in the stroma (pink dot on mapping) (original magnification ×200).
