
Figure 2.
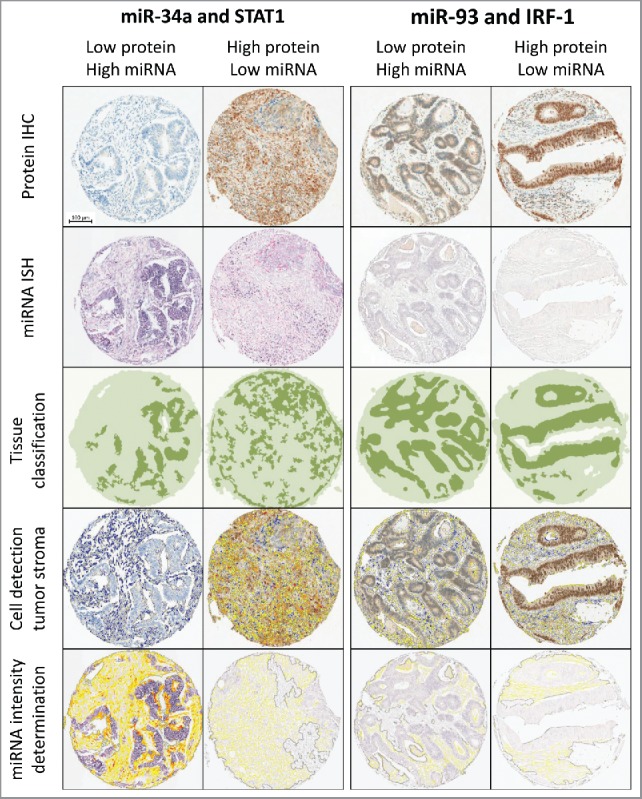
Workflow of sequential digital image analysis of STAT1 and IRF-1 protein immunohistochemistry and miR-34a and miR-93 in situ hybridization. Four example cases with different expression levels are shown (columns). STAT1 and IRF-1 expression was visualized by immunohistochemistry (top row). Cells were quantified and IHC staining intensity was analyzed using HALO™ (Indica Labs) digital image analysis software (second row). Image guided tissue segmentation was performed to specifically analyze protein expression patterns in tumor stroma (third row). Strict serial sections were analyzed for miR-34a and miR-93 expression by miRNA ISH (fourth row). miRNA expression patterns in the tumor stroma were quantified using the protein tissue classification mask (bottom row).