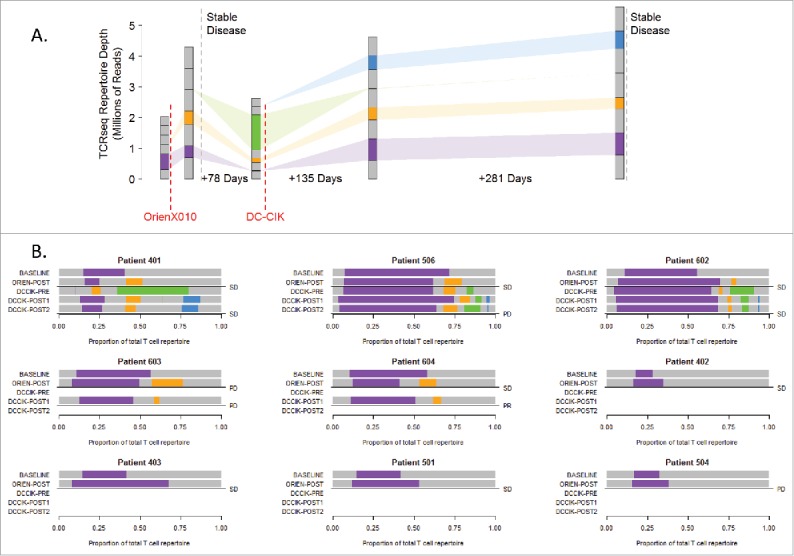
Figure 3.

Clone populations in TCR β repertoires. (A) Schema for patient 401 tracks clone populations over time and b/w OrienX010 and DC–CIK treatments: purple clones first appear in the baseline sample, orange in the post-ORIEN sample, green in the pre-DC–CIK, and blue in the post-DC–CIK. (B) Patients 401, 506, 602, 603, and 604 received both OrienX010 and DC–CIK therapy, whereas patients 402, 403, 501, and 504 received OrienX010 only.
