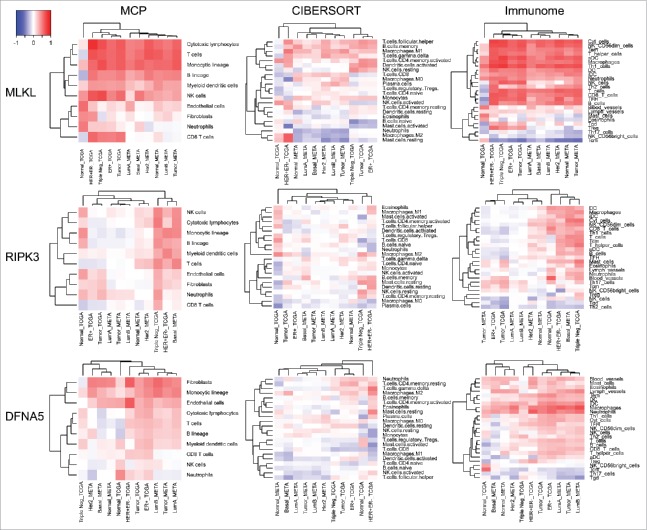
Figure 5.
Heatmap representation of Spearman correlation coefficients. Correlations between three genes (MLKL, RIPK3 and DFNA5) and between activities of different immune cells are indicated. Immune cell densities were estimated by three different methods: MCP-counter, CIBERSORT and IMMUNOME. Datasets are from TCGA and METABRIC breast cancer microarrays (normal tissue, all primary tumors and tumor subgroups).

