Figure 1.

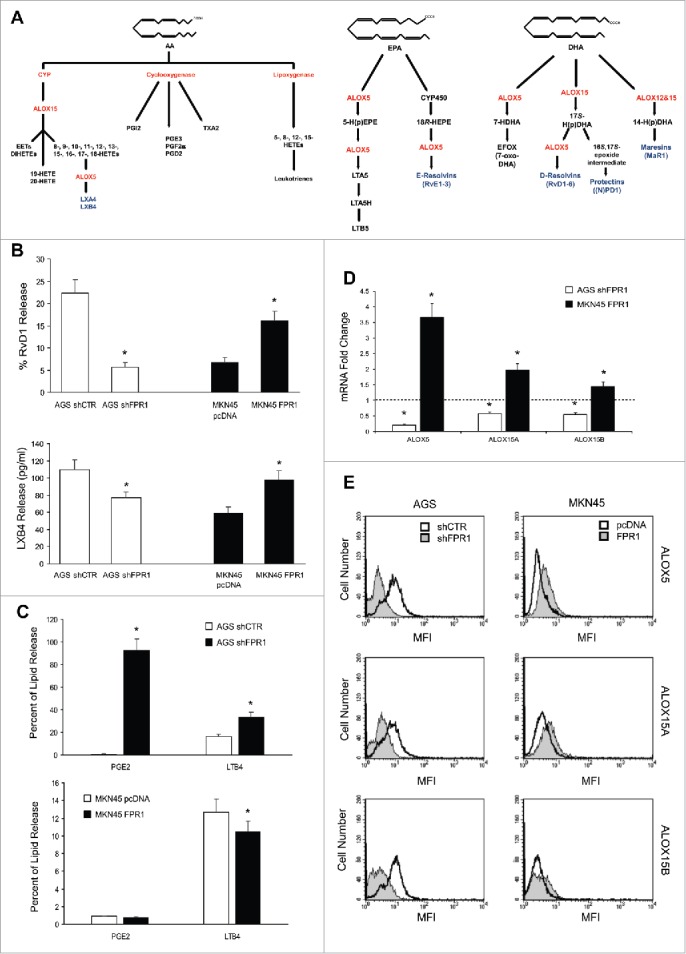
Relation between FPR1 expression and SPM biosynthesis machinery. (A) Schemes of arachidonic acid-AA, docosahexaenoic acid-DHA, and eicosapentaenoic acid-EPA metabolism. (B) AGS shFPR1 cl 15 cells produced significantly lower amounts of RvD1 and LXB4 compared to AGS shCTR cells, while MKN45 cells overexpressing FPR1 (MKN45 FPR1 cl 4) released higher amounts of RvD1 and LXB4 compared to empty vector transfected cells (MKN45 pcDNA), as evaluated by EIA assays. Data are represented as mean ± SD of five independent experiments. *p < .05 compared to the relative control. (C) Increased release of PGE2 and LTB4 from shFPR1 AGS cells and from MKN45 pcDNA cells compared to the relative control cells, assessed by EIA. Data are represented as mean ± SD of three independent experiments. *p < .05 compared to the relative control. (D) AGS shFPR1 cl 15 expressed significantly lower levels and MKN45 FPR1 cl 4 significantly higher levels of ALOX5, ALOX15A, and ALOX15B mRNAs compared to relative controls (dotted line), as assessed by real-time PCR. Data are represented as mean ± SD of three independent experiments. *p < .05 compared to the relative control. (E) ALOX5, ALOX15A, and ALOX15B protein levels were lower in AGS shFPR1 vs. AGS shCTR, and in MKN45 pcDNA vs. MKN45 FPR1 cells, as evaluated by cytofluorimetric analysis. One representative experiment out of three is shown.
