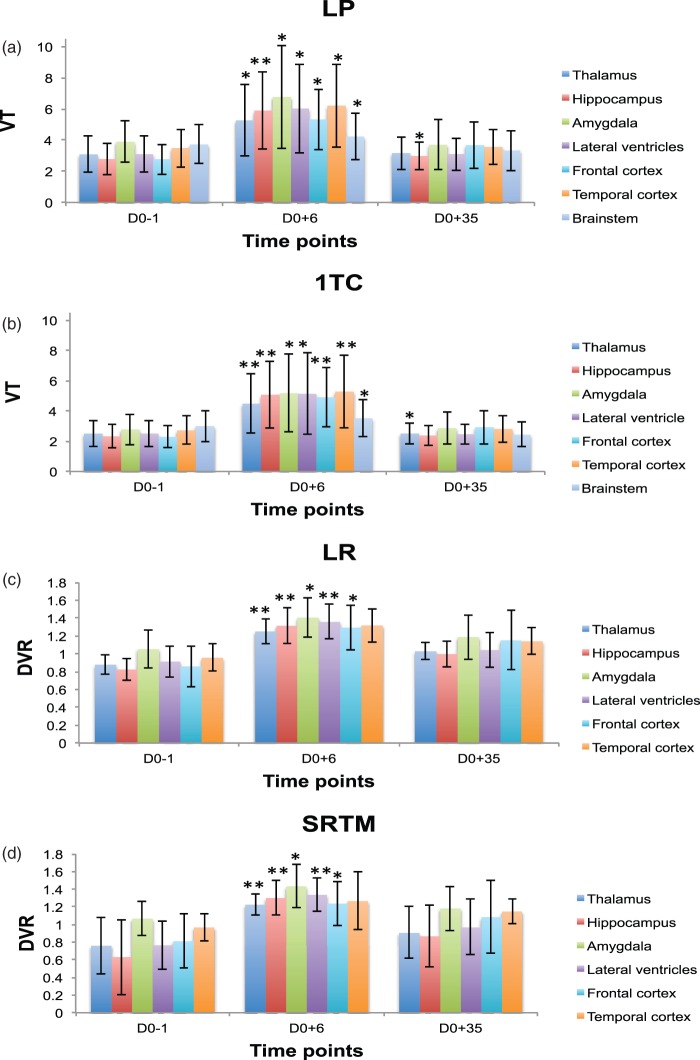
Figure 2.
Mean left/right regional VT and DVR (mean ± SD) time course data before (D0-1) and after (D0 + 6, D0 + 35) pilocarpine-induced SE in selected brain structures (* highlights p values < 0.05 and ** for p < 0.009 computed with t test against baseline): (a) Logan plot model, (b) one tissue compartment model, (c) Logan reference model, (d) simplified reference tissue model. Changes were considered significant in a structure when they were significant both on the left and the right side of the given structure. Seven rats had arterial input functions and could be analysed with the 1TC and LR models; all nine could be used for the LR and SRTM models.

