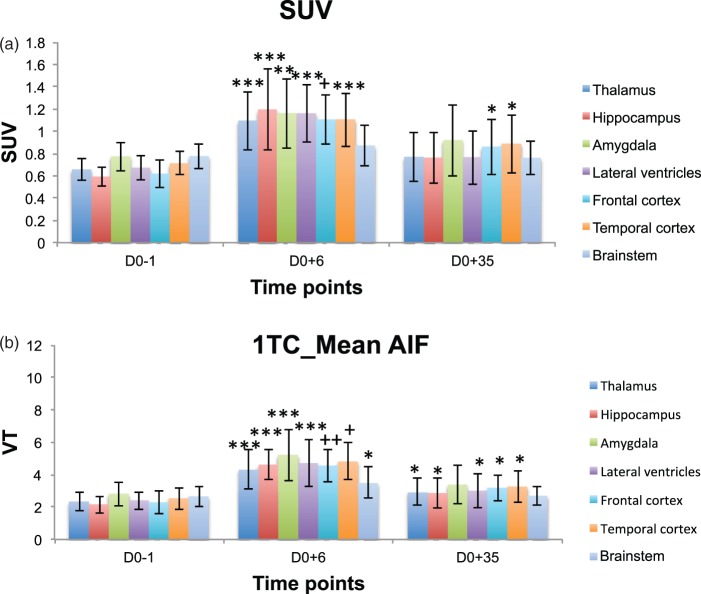
Figure 4.
Mean left/right regional VT and SUV (mean ± std) time course data before (D0-1) and after (D0 + 6, D0 + 35) pilocarpine-induced SE in selected brain structures (* highlights p values < 0.05 and ** for p < 0.005, *** for p < 5*10 − 4, + for p < 5*10−5, ++ for p < 5*10−6 computed with t test against baseline): (a) SUV, (b) 1TC – one tissue compartment model using a normalised mean arterial input function (normalised according to the injected dose and the weight of each rat, and averaged over seven rats). Changes were considered significant in a structure when they were significant both on the left and the right side of the given structure.

