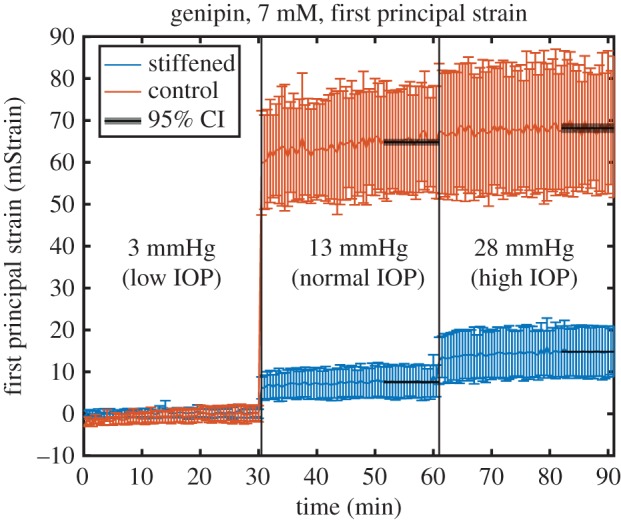
Figure 4.

Representative plot of average first principal strain as a function of time from a single eye during our inflation experiment. Eyes were maintained for 30 min at each of three pressures representing different ranges of IOP. Strains were considerably higher in the control region of the eye than in the treated region, indicating that the treated region is stiffer. Black overlays represent the 95% CI about the mean during the final 10 min of each pressure step, when the eye reached steady state. Error bars: standard deviation over the interrogated region. Raw data to generate these figures are included in the electronic supplementary material.
