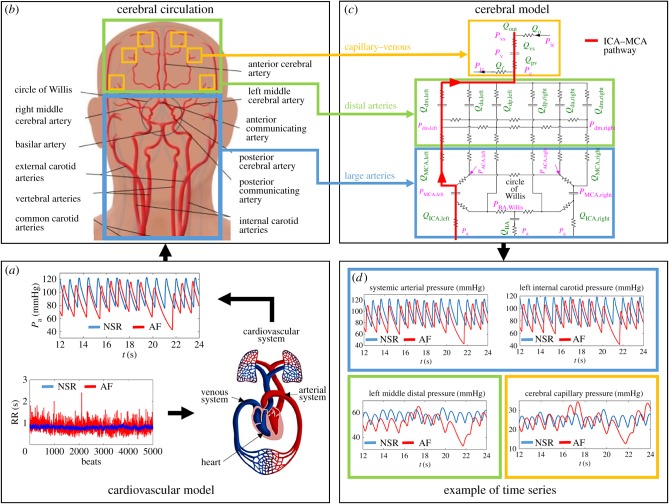
Figure 1.
Scheme of the in silico approach (the figure should be read clockwise starting from the left bottom). (a) Cardiovascular model: 5000 extracted RR records in NSR (blue) and AF (red), and examples of Pa time series obtained through the cardiovascular model. (b) Cerebral circulation: sketch of the cerebral vasculature forced by the Pa input, which is obtained from the cardiovascular model described in (a). (c) Cerebral mathematical model: R, resistance; C, compliance; Q, flow rate; P, pressure. The left ICA–MCA pathway is highlighted in red and is composed of Pa, QICA,left, PMCA,left, QMCA,left, Pdm,left, Qdm,left, Pc and Qpv. (d) Examples of pressure time series. Representative resulting time series for the pressure along the ICA-MCA pathway, in NSR (blue) and AF (red) conditions, obtained from the cerebral model described in (c). In (b–d), the coloured boxes refer to different cerebral regions: large arteries (light blue), distal arteries (green) and capillary/venous circulation (yellow).

