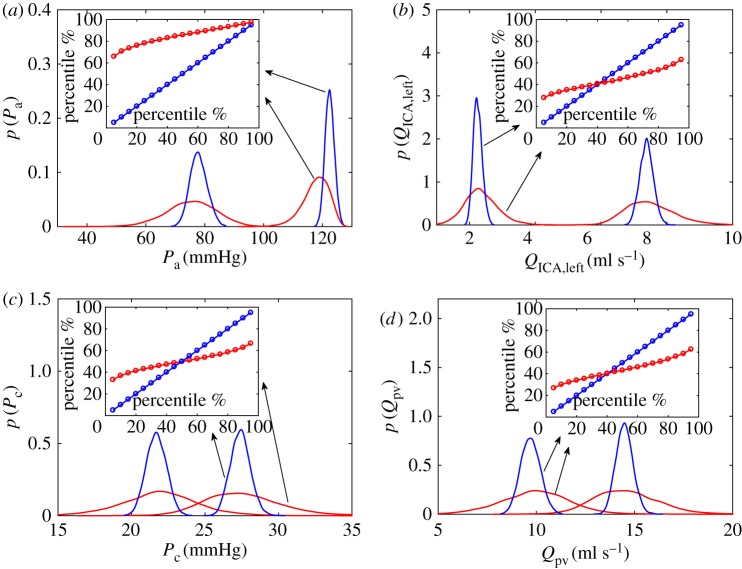
Figure 5.
PDFs of the maximum (Pmax and Qmax) and minimum (Qmin and Pmin) values (NSR, blue; AF, red). Pressure (a,c) and flow rate (b,d) from large arteries (a,b) to the capillary/venous region (c,d). Inserts represent the percentile analysis, showing how percentiles in NSR are modified in AF. Percentiles of maxima are reported for pressures, while percentiles of minima are shown for flow rates.

