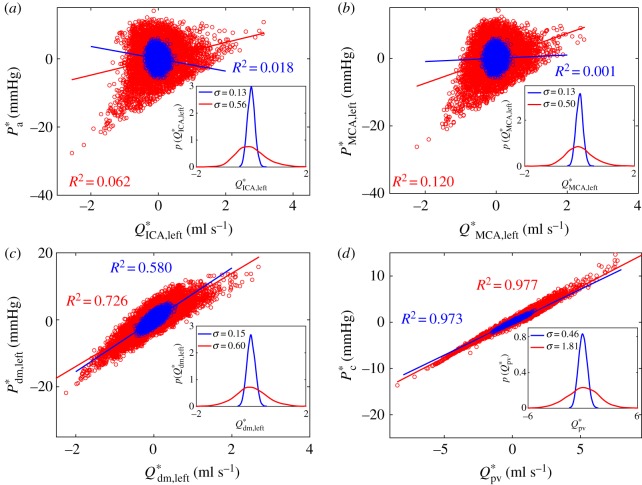
Figure 6.
Analysis of the mean values per beat (NSR, blue; AF, red). Scatter plots: (a) large arteries P*a and Q*ICA,left, (b) middle cerebral artery P*MCA,left and Q*MCA,left, (c) middle distal region P*dm,left and Q*dm,left and (d) capillary–venous region P*c and Q*pv. Inserts represent the PDFs of mean flow rate values, Q*i. Coefficients of determination, R2, and the linear fittings are computed for each configuration.

