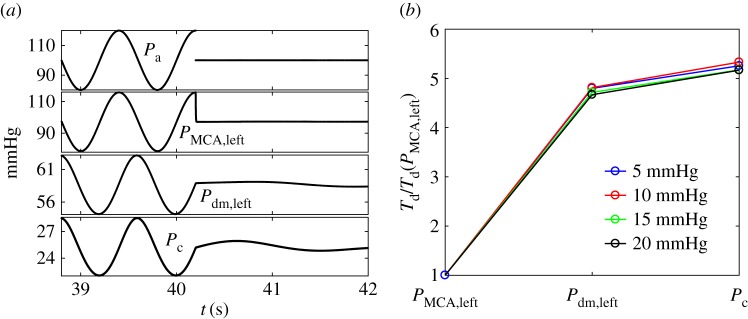
Figure 9.
(a) Sinusoidal Pa signal (mean 100 mmHg, amplitude 20 mmHg) abruptly interrupted at its maximum (top panel) and pressure response in the downstream cerebral districts (PMCA,left, Pdm,left, Pc). (b) Temporal delays, Td, normalized with respect to the corresponding value in the first region (PMCA,left) along the ICA–MCA pathway.

