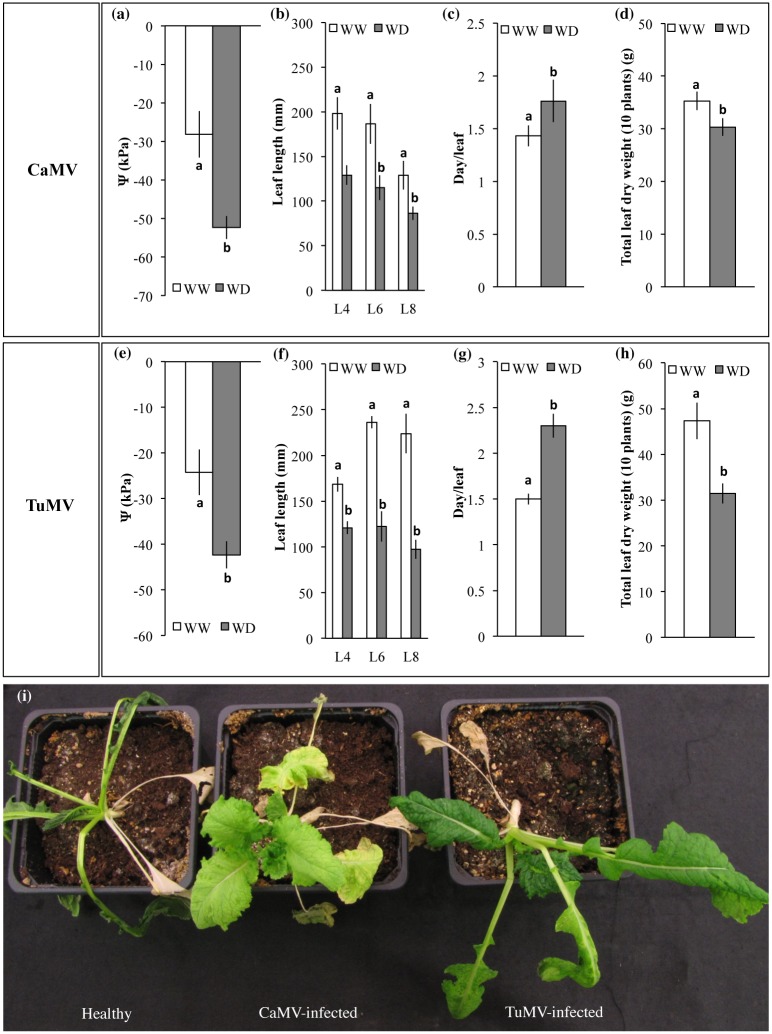
Fig 1. Morpho-physiological traits of CaMV- and TuMV-infected plants grown under Well-Watered (WW) or Water Deficit (WD) conditions.
(a, e) Water potential (Ψ) of L8 of CaMV or TuMV infected plants at the end (Day 9) of the water deprivation regime (n = 12 for both CaMV and TuMV infected plants). (b, f) Length of fully expanded leaves L4, L6 and L8 of CaMV or TuMV infected plants (n = 20 per leaf level for both virus species). (c, g) average time required for the appearance of each newly formed leaf on CaMV or TuMV infected plants (n = 20 in both cases). (d, h) Total dry weight of leaves from pools of 10 CaMV or 10 TuMV infected plants (npools = 3 in both cases). (i) Illustration of the protective effects of CaMV and TuMV infection on turnip response to severe water deficit. Healthy (mock-inoculated), CaMV-infected and TuMV-infected plants are shown 30 days after total water withholding. (a-h) Bars represent SEM and different lowercase letters indicate significant differences between water treatments according to a Student’s t-test (p ≤ 0.05, see text). Details on plants used in the different morpho-physiological traits measurements are summarized in S1 Table.

