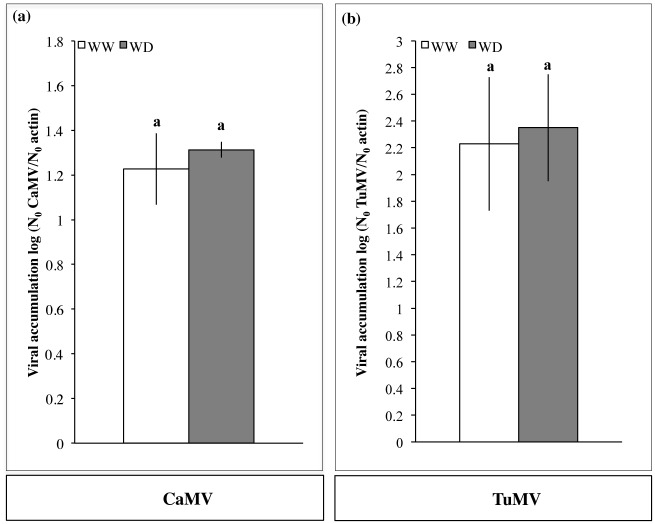
Fig 3. Effect of water deficit on the virus accumulation in infected source plants.
Viral accumulation in the infected source plants used in transmission assays was estimated in leaf 8 by qPCR and RT-qPCR for (a) CaMV- and (b) TuMV- infected plants, respectively (n = 30 for both the WW and WD conditions). Bars represent 95% confidence intervals of normalized viral accumulation (log (N0 virus/N0 actin)), and similar lowercase letters indicate non-significant differences between water treatments according to a Student’s t-test (p ≤ 0.05) for CaMV and TuMV, respectively.

