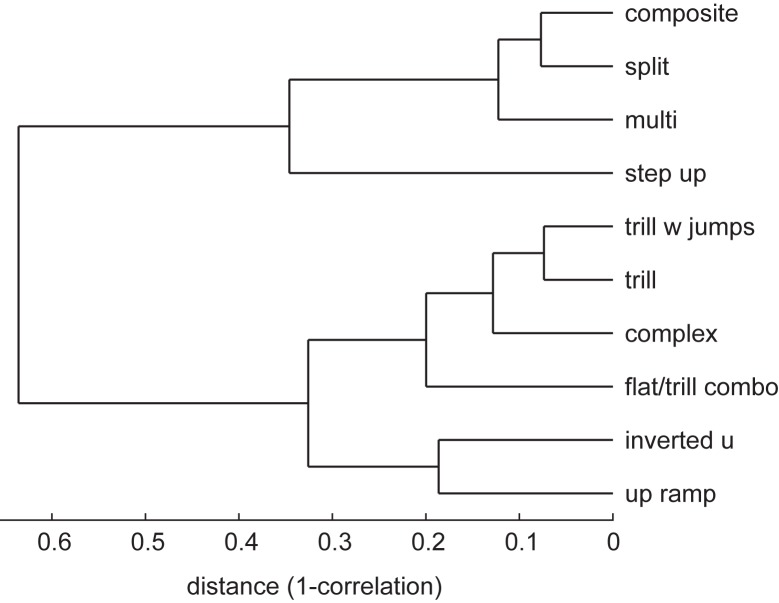
Fig 5. Dendrogram showing the relative similarity of different call types based on behavioral correlates.
The x-axis shows the distance between pairs of vocalizations based on the correlation between their behavioral z-scores (i.e., the rows of Fig 3). The dendrogram was generated using the Unweighted Pair Group Method with Arithmetic Mean (UPGMA) algorithm. As with Figs 3 and 4, data from the 4 least frequent vocalizations have been omitted.

