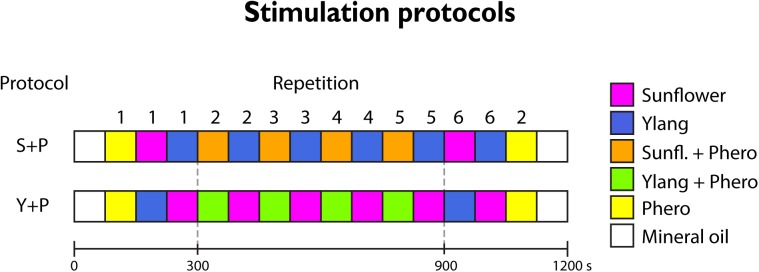
Fig 2. Sequence of odor stimuli for the 2 protocols.
Colored squares indicate recordings of individual stimuli. Each stimulus lasted 2 s, with the recording starting 3 s before odor onset and lasting for 15 s. Time between recordings (and each odor stimulus onset) was 75 s. The time scale is nonlinear due to the breaks between recordings, and indicate elapsed time after the initial presentation of the individual odors (300 s) and after the repeated alternate sequence of the phero-paired and unpaired plant odor presentations (900 s).

