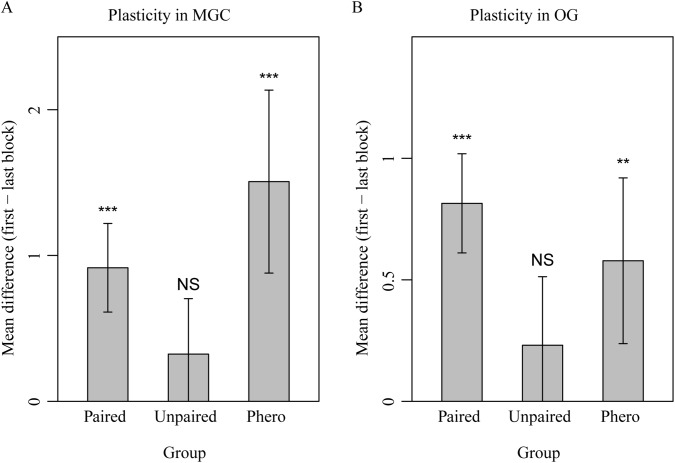
Fig 6. Mean ± 95CI of difference in response strengths between first and last repetition of the pheromone-paired plant blend, the unpaired plant blend, and the pheromone alone.
Repetitive stimulation with paired pheromone-plant odor resulted in suppressed responses to both the pheromone and to the plant odor which was paired with it, but not to the unpaired plant odor. This suppression (positive value in the plot) was present in the MGC when averaged over glomeruli (A) and in the OG (B), indicating plastic changes in the AL network. Asterisks indicate changes from first to last repetition that are statistically larger than zero (paired t-tests: p < 0.05, ‘**’ p < 0.01, ‘***’ p < 0.001, ‘NS’ Not Significant).

