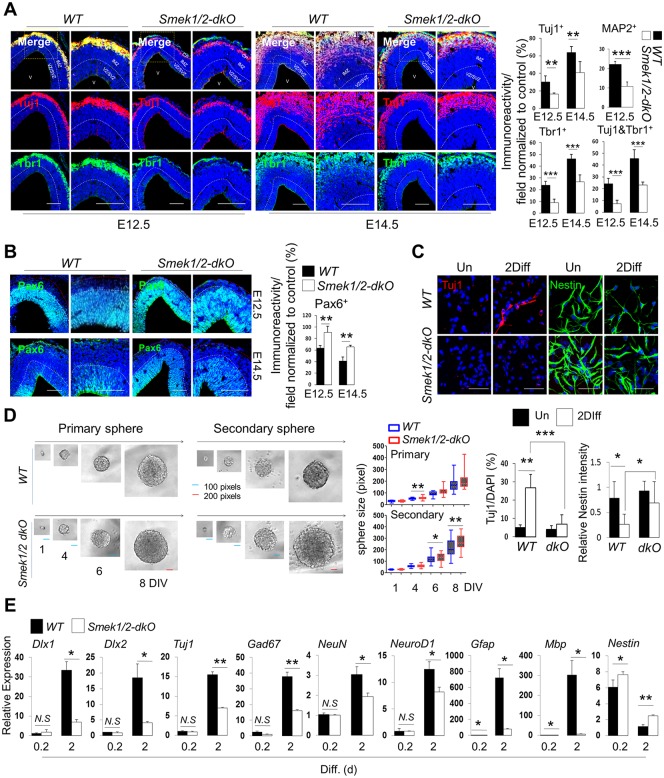
Fig 1. Suppressor of Mek null (Smek) expression and function in mouse cortical development.
(A) Fixed cyroembedded coronal sections from E12.5 or E14.5 mouse forebrain stained with antibodies against Tuj1 (red), Tbr1 (green), and microtubule-associated protein 2 (MAP2) (red). Nuclear staining is shown by 4',6-diamidino-2-phenylindole (DAPI) (blue). (Right) Quantification of Fig 1A and S1D Fig. (E12.5: WT, n = 4, dKO, n = 5; E14.5: WT, n = 6, dKO, n = 5). Scale bars, 50 μm. (B) Same as Fig 1A for Pax6. (Right) Quantification of Fig 1B (E12.5: WT, n = 5, dKO, n = 4; E14.5: WT, n = 6, dKO, n = 3). Scale bar, 50 μm. (C) Immunostaining with Nestin (green) and Tuj1 (red) antibodies in WT and Smek1/2 dKO neural progenitor cells (NPCs). Nuclear staining is shown by DAPI (blue). Scale bars, 50 μm. (Lower) Quantification of anti-Tuj1–positive (WT-Un, n = 3; WT-2DIV, n = 6; dKO-Un, n = 3; dKO-2DIV, n = 6) and anti-Nestin–postive (WT-Un, n = 6; WT-2DIV, n = 6; dKO-Un, n = 6; dKO-2DIV, n = 6) cells in Fig 1C. Un, undifferentiation; 2Diff, differentiation 2 d in vitro (DIV). (D) Single cells of WT and Smek1/2 dKO NPCs were separated by serial dilution and sphere formation was induced for 8 d in vitro. Relative size of primary spheres grown up to 8 DIV were quantified by the ImageJ quantification software. Scale bars, blue (100 pixel), red (200 pixel). (E) Quantitative PCR (qPCR) analysis of indicated mRNAs. Values correspond to the average ± SD. Diff. (d), days in differentiation. Statistical t test analysis was performed to calculate significance (*p < 0.05, **p < 0.005, ***p < 0.0005; not significant (ns), p > 0.05). All quantification data underlying panels A–D can be found in S2 Data.

