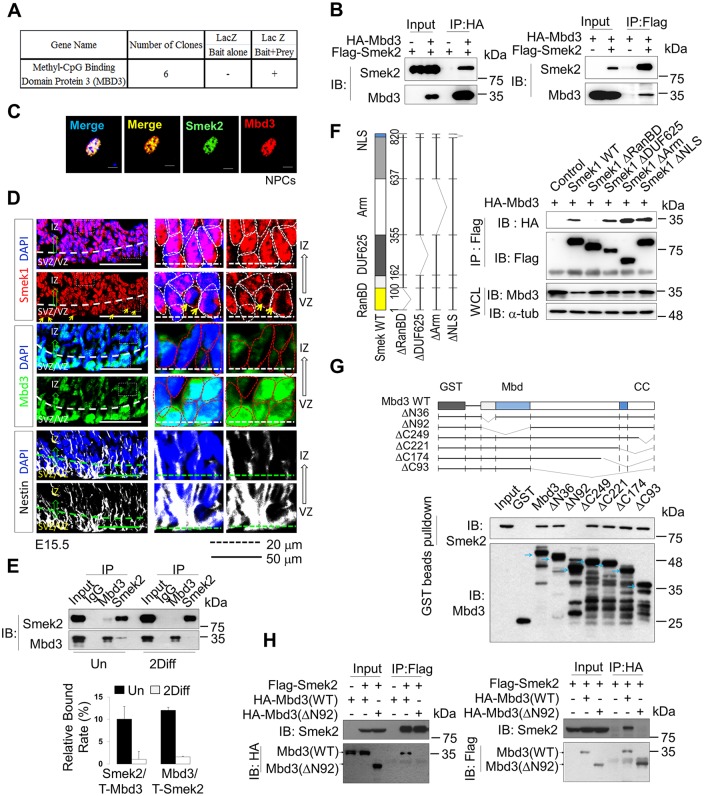
Fig 2. Suppressor of Mek null (Smek) interacts with methyl-CpG–binding domain protein 3 (Mbd3) and both colocalize in the nucleus.
(A) Numerical result of clones observed by β-galactosidase colony-lift filter assay using bait (Smek2) and prey (Mbd3). (B) Coimmunoprecipitation (co-IP) of human influenza hemagglutinin (HA)-tagged Mbd3 or Flag-tagged Smek2 in HEK293T cells transfected with Mbd3 and/or Smek (n = 2). IB, immunoblot. (C) Immunostaining with Mbd3 (red) and Smek2 (green) antibodies in NPCs. Nuclear staining is shown by 4',6-diamidino-2-phenylindole (DAPI) (blue). Scale bar, 50 μm. (D) Fixed, cyroembedded coronal sections from E15.5 mouse forebrain stained with antibodies against Mbd3 (green), Smek1 (red), and Nestin (white). Nuclear staining is shown by DAPI (blue). Yellow arrows indicate perinuclear localization of Smek1 in ventricular zone progenitor cells. (E) Co-IP of endogenous Smek2 and Mbd3 in undifferentiated (left) and differentiated (right) NPCs using anti- immunoglobulin G (IgG) (negative control), anti-Mbd3, or anti-Smek2 antibodies (n = 2). Un, undifferentiation; Diff, differentiation. (F) (Upper) Schematic of Smek1 mutants used in deletion analysis. (Lower) Co-IP of these Smek1 mutants with HA-tagged Mbd3 in the cells expressing full-length HA-tagged Mbd3 and Flag-tagged deletion Smek1 mutants (n = 2). Immunoprecipitation was performed using an anti-Flag antibody and immunoblotting was done using an anti-HA antibody. WCL, whole cell lysate. (G) (Upper) Schematic showing Mbd3 deletion mutants used in domain mapping analysis. (Lower) Glutathione-S-transferase (GST) pull-down assay using of purified GST, GST-Mbd3, or deletion mutants that were mixed with Smek2-overexpressing cell lysate. Immunoblotting was performed using Smek2 and Mbd3 antibodies. Blue arrows indicate major bands of each GST-fused Mbd3 mutant protein expression. (H) Co-IP of Smek with full-length or mutant Mbd3 (n = 1). Black arrows indicate band of each full-length or mutant (ΔN92) Mbd3. All quantification data underlying panel A can be found in S2 Table and quantification data for panel E can be found in S2 Data.

