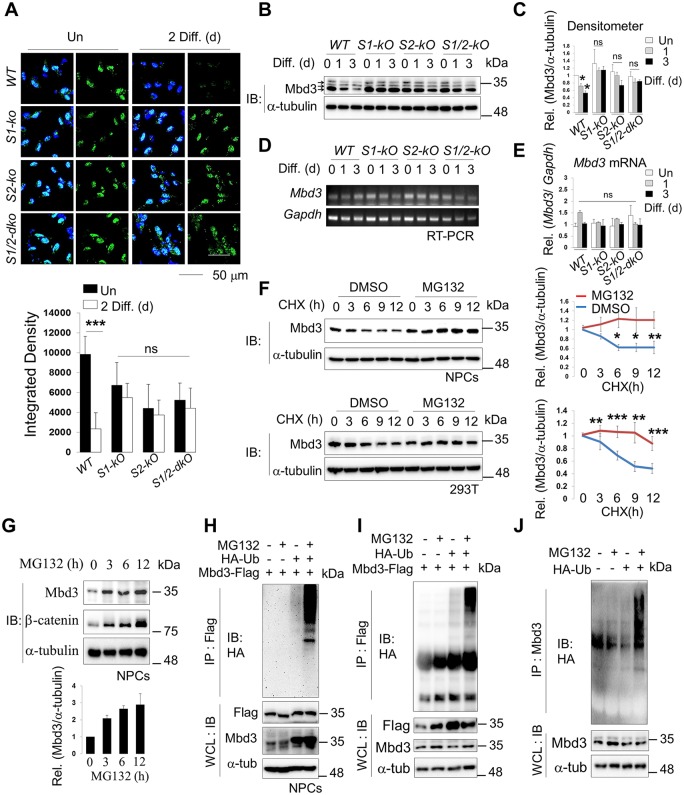
Fig 3. Both endogenous and overexpressed methyl-CpG–binding domain protein 3 (Mbd3) are degraded as neural progenitor cells (NPCs) differentiate.
(A) Immunostaining to detect Mbd3 expression in wild-type (WT), Smek1 knockout (S1-KO), Smek2 knockout (S2-KO) and Smek1/2 double knockout (S1/2-dKO) cells. Nuclear staining is shown by 4',6-diamidino-2-phenylindole (DAPI) (blue). Mbd3 is shown in green. Scale bar, 50 μm. (Lower) Quantification of Fig 3A. Scale bar, 50 μm. Diff. (d), differentiation days in vitro. (B) Western blot of Mbd3 in WT or Smek knockout NPCs that are under differentiation for 0, 1, or 3 d (n = 3). α-tubulin was used as an internal loading control. Arrows indicate multiple Mbd3 isoforms around 30–40 kDa (upper, Mbd3A; middle, Mbd3B; bottom, Mbd3C). (C) Quantification of Fig 3B. (D) Reverse transcription PCR (RT-PCR) analysis of Mbd3 and Gapdh transcript levels at indicated days (d) of differentiation (n = 2). (E) Quantification of data shown in Fig 3D. (F) (left panel) Immunoblot (IB) analysis of Mbd3 and α-tubulin in cells treated with cycloheximide (CHX) for indicated times (h, hours) with or without MG132 in NPCs (n = 3) or 293T cells (n = 5). (Right panel) Quantification of band intensity in Fig 3F, left panel using the ImageJ software. (G) NPCs were treated with MG132 for 6 h, harvested, and the lysates were immunoblotted with anti-Mbd3, anti–α-tubulin and anti–β-catenin antibodies. β-catenin was used as a positive control (n = 2). Quantification of band intensity in Fig 3G, bottom panel using the ImageJ software. (H) Ubiquitylation of overexpressed Mbd3 in NPCs (n > 3). (I) Ubiquitylation of overexpressed Mbd3 in HEK293T transfected with Flag-Mbd3 and HA-Ub expression vectors and treated 1 d later with MG132 were detected by immunoprecipitation with Flag antibody followed by immunoblotting with HA antibody (upper panel) (n > 2). Levels of each protein in the whole cell lysate are shown with western blot. (J) Same as panels H and I except that endogenous Mbd3 polyubiquitylation was shown (n = 3). Values correspond to the average ± SD. Statistical t test analysis was performed to calculate significance (*p < 0.05, **p < 0.005, ***p < 0.0005; not significant (ns), p > 0.05). All quantification data underlying panels A, C, E, F, and G can be found in S2 Data.

