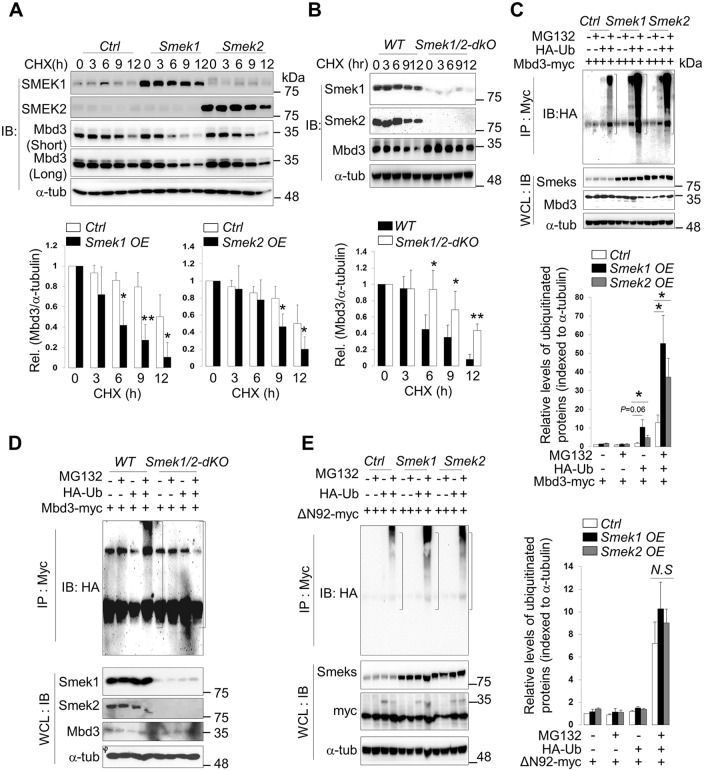
Fig 4. Suppressor of Mek null (Smek) promotes methyl-CpG–binding domain protein 3 (Mbd3) degradation and polyubiquitylation.
(A) HEK293 cells and cell lines stably expressing Smek1 or Smek2 were treated with cycloheximide (CHX) for indicated times and whole cell lysates were prepared for immunoblotting (n = 4). (Lower) Quantification of band intensities is shown in the lower panel. (B) Wild-type and Smek1/2 dKO NPCs were treated with CHX for indicated times (h, hours) and harvested, and then lysates were immunoblotted (n = 3). (Lower) Quantification of band intensities. OE, overexpression; Ub, ubiquitin. (C) Ubiquitylation assay of Mbd3 using control and Smek1 or Smek2 stable HEK293T transfected with Mbd3-myc and HA-Ub expression vectors and treated 1 d later with MG132 for 6 h (upper blot) and IB for indicated proteins (lower blot). (Lower) Quantification of band intensities (n = 3). (D) Same as panel C except using WT or Smek1/2 dKO NPCs (n = 2). (E) Same as panel D except using cells transfected with Mbd3(ΔN92)-myc and HA-Ub expression vectors at control and Smek1 or Smek2 stable cell lines (n = 2). In (A–C and E), quantification of band intensity was done using ImageJ. Data are presented as average ± SD. Statistical t test analysis was performed (*p < 0.05, **p < 0.005, ***p < 0.005; not significant (ns), p > 0.05). All quantification data underlying panels A, B, C, and E can be found in S2 Data.

