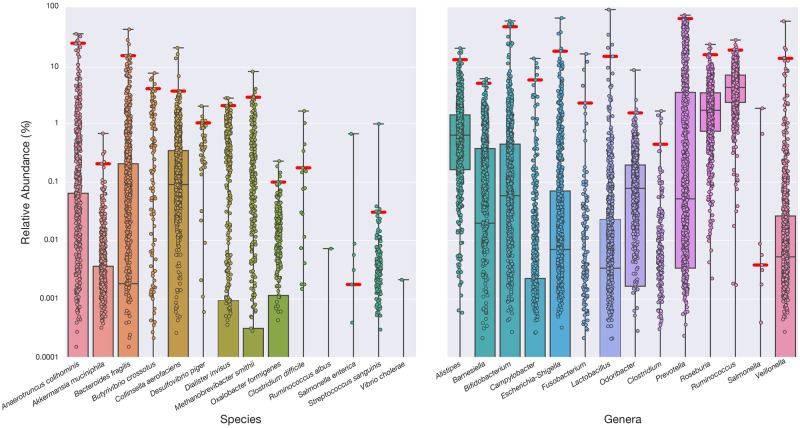
Fig 3. Reference ranges from a cohort of healthy individuals for 28 clinically relevant species and genera.
Healthy participant stool microbiome data were analyzed to determine the empirical reference ranges for each target. The boxplot displays the relative abundance for each of 897 self-reported healthy individuals, revealing the healthy ranges of abundance for the taxa in the test panel. The healthy distribution is used to define the 99% confidence interval (red line). Boxes indicate the 25th–75th percentile, and the median coverage is indicated by a horizontal line in each box. Even in this healthy cohort, many of the bacteria that are associated with poor health conditions are present at some level. As most taxa are absent in a significant number of individuals most boxes expand to 0%, the healthy lower limit (not shown).

