
FIGURE 4:
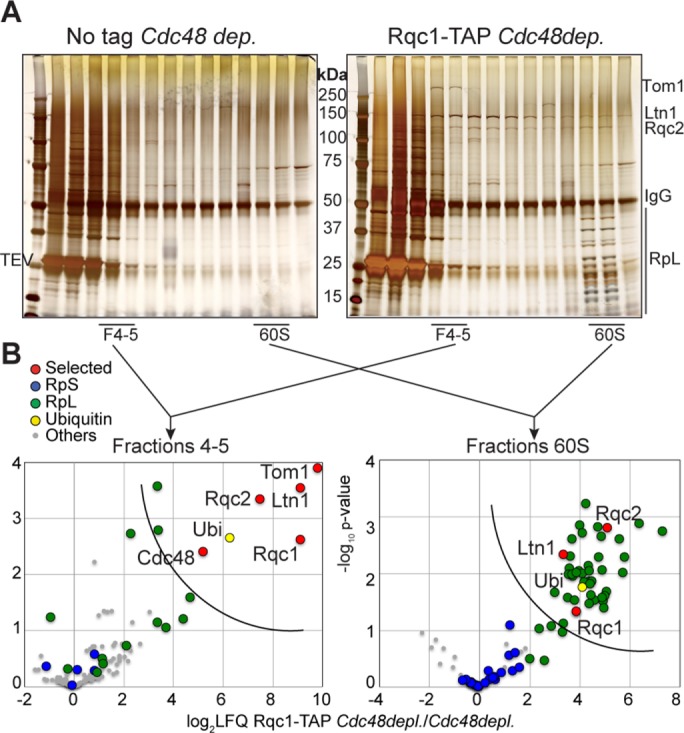
Tom1 interacts significantly with the light-sedimenting RQC complex. (A) Silver-staining analysis of the proteins fractionated from Rqc1-TAP (right) vs. negative control (left) purifications upon Cdc48 depletion. (B) Proteins associated with Rqc1-TAP complexes cosedimenting with fractions 4 and 5 (left) or the 60S (right) were identified by LC-MS/MS, and t tests of LFQ intensities for each protein were performed in comparison with the negative control. Statistical results are given in the form of volcano plots. The x-axis shows the log2 of LFQ ratios between the samples, and the y-axis shows the –log10 of the p value of each protein enrichment among statistical groups. The semicircular curve defines candidates that are significantly enriched according to a statistical t test. These purifications coupled with gradient fractionation were repeated four times. The list of proteins identified is given in Supplemental Dataset S1.