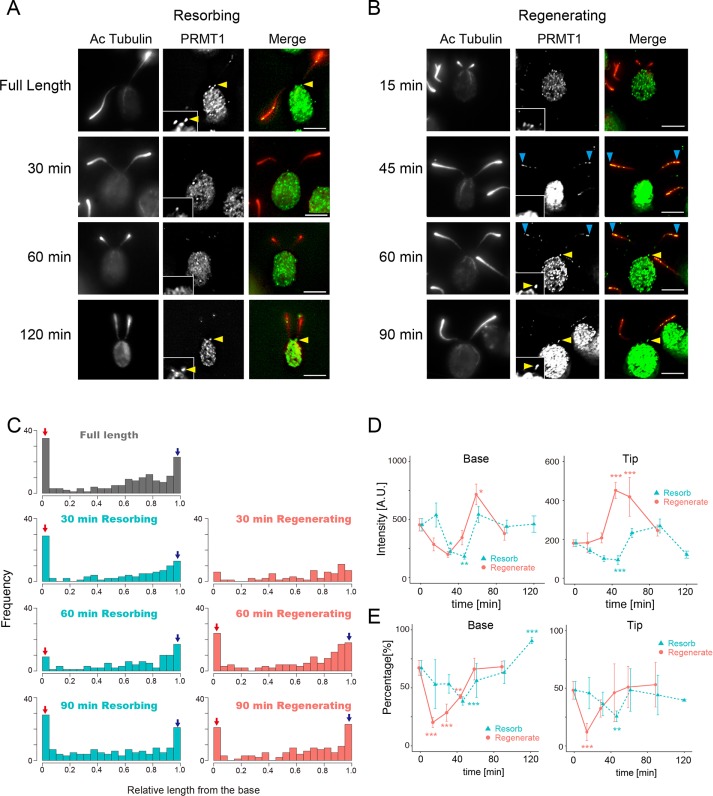
FIGURE 3:
PRMT 1 changes localization during flagellar regeneration and resorption. (A) Immunofluorescence microscopy of WT cells with resorbing flagella, using anti–acetylated tubulin (Ac-tubulin, red) and anti-PRMT 1 antibodies (green). PRMT 1 is not often observed at the base of flagella at 30 and 60 min after the initiation of resorption but reappears at the base by 120 min. Insets, enlarged images of the flagellar base. Yellow arrowheads indicate the accumulation of PRMT1 at the proximal end of the flagella. Scale bars, 5 µm. (B) Immunofluorescence microscopy of WT cells with regenerating flagella, using anti–Ac-tubulin (red) and anti-PRMT 1 antibodies (green). PRMT 1 is absent from the base during flagellar regeneration (15–45 min) but reappears at 60–90 min. Insets, enlarged images of the flagellar base. Yellow arrowheads indicate PRMT1 in the proximal end of the flagella. Blue arrowheads indicate localization of PRMT1 at the tip. Scale bars, 5 µm. (C) Histograms of PRMT 1 localization along the length of resorbing (left) and regenerating (right) flagella. Red arrows indicate the relative number of puncta at the base of the flagella, and blue arrows indicate the tip accumulation. (D) Quantification of PRMT 1 intensity at the base (left) and the tip (right) during regeneration (red) or resorption (green). Mean ± SEM from three independent experiments for each time point. For these data, the tip corresponds to the value of 0.95–1.0 in relative flagellar length (the rightmost bin in C). The base corresponds to the value of 0.0–0.05 in relative flagellar length (leftmost bin in C). The number of flagella and puncta analyzed for each time point are listed in Supplemental Table S1. Statistical significance was determined by the Steel–Dwass test. *p < 0.05, **p < 0.01, ***p < 0.001. (E) Comparison of the percentage of flagella with basal PRMT 1 signal (left) and tip PRMT 1 signal (right) during regeneration (red) or resorption (green). Mean ± SEM from three independent experiments. The number of flagella and the number of puncta analyzed are summarized in Supplemental Table S1. Statistical significance was determined by Fisher’s exact test, with correction for multiple comparison using Holm’s method. *p < 0.05, **p < 0.01, ***p < 0.001.

