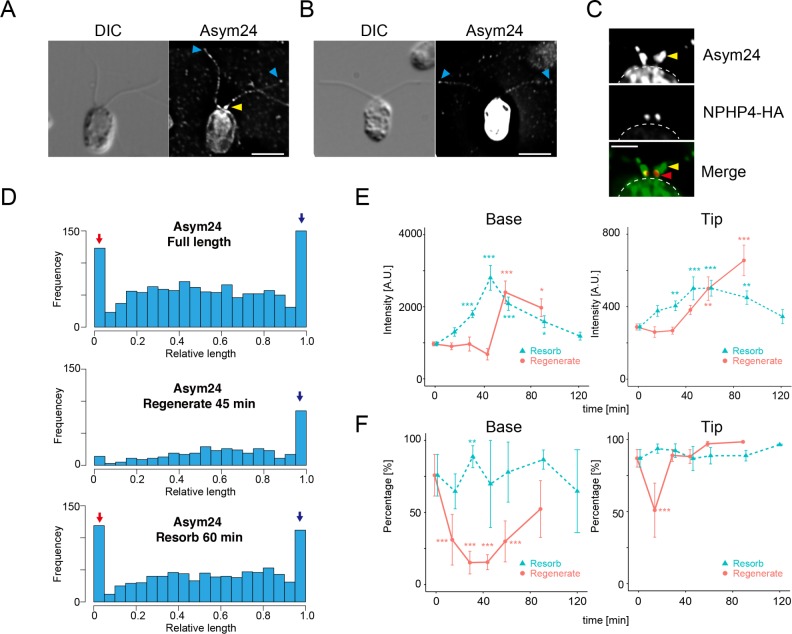
FIGURE 8:
Flagellar proteins modified with aDMA are present at the flagellar base and tip. (A) Immunofluorescence microscopy of a WT cell using Asym24 antibodies that label aDMA-modified proteins. In this image, the cell body is not strongly stained. The flagellar base and tip are labeled with Asym24, and a punctate pattern of stain is observed along the flagella length. (B) In comparison to the cell in A, some cells in the same preparation showed very strong labeling of the cell body. Label at the flagellar tip was also observed, but the enrichment at the flagellar base is not clearly visible in cells with strong cell body staining. Yellow arrowheads indicate accumulation of aDMA in the proximal region of the flagella. Blue arrowheads indicate localization of aDMA at the flagellar tip. Scale bar, 5 µm (A, B). (C) Immunofluorescence microscopy of a NPHP4-HA cell using Asym24 and anti-HA antibodies. The signal from Asym24 at the flagellar base was observed at the transition zone and at more distal region near the flagellar base. These images are comparable to that of PRMT 1 and PRMT 3 localization (Figure 2). The border of the cell body is indicated by the dashed line. Yellow arrowheads indicate accumulation of aDMA in the proximal region of the flagella. Red arrowheads indicate the location of NPHP-HA. Scale bar, 2 µm. (D) Histograms of Asym24 signal localization along the flagella in cells with full-length flagella (top), regenerating flagella (45 min regenerating; middle), and resorbing flagella (60 min resorbing; bottom). In cells with full-length flagella, the accumulation of Asym24 signal at the flagellar base (red arrow) and the tip (blue arrow) is clearly visible (top). The basal signal of Asym24 is lost in regenerating flagella. but enrichment at the tip is maintained (blue arrow; middle). In resorbing flagella, strong enrichment at the base and the tip is observed (red and blue arrow, bottom). (E) Comparison of Asym24 intensity during flagellar regeneration (red) or resorption (green). Intensity of the flagellar base (left) or tip (right) is plotted as a function of time after the initiation of flagellar resorption or regeneration. Mean ± SEM from three independent experiments. For these data, the tip corresponds to the value of 0.95–1.0 in relative flagellar length (the rightmost bin in D). The base corresponds to the value of 0.0–0.05 in relative flagellar length (leftmost bin in D). Numbers of flagella and puncta for each time point are summarized in Supplemental Table S3. Statistical significance was determined by the Steel–Dwass test. *p < 0.05, **p < 0.01, ***p < 0.001. (F) Comparison of the percentages of flagella with a basal (left) and tip (right) Asym24 signal plotted as a function of the time after initiation of resorption or regeneration. Mean ± SEM from three independent experiments. The number of flagella and puncta counted are summarized in Supplemental Table S3. Statistical significance is determined by the Fisher’s exact test, with correction for multiple comparison with Holm’s method (**p < 0.01, ***p < 0.001).

