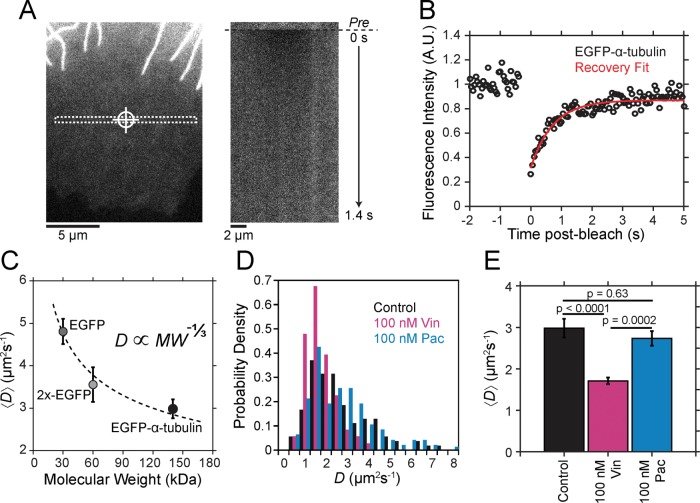
FIGURE 7:
Vinblastine promotes tubulin oligomerization in the cytoplasm. (A) Left, periphery of an LLC-PK1α cell expressing EGFP–α-tubulin. Cross-hairs indicate the position where the laser was centered for photobleaching. Box with dotted line is the region used to create the montage shown on the right. Right, time series of the boxed region showing fluorescence intensity levels during prebleach, postbleach, and recovery. (B) Normalized EGFP–α-tubulin fluorescence in time from the cell shown in A. Red line is the best-fit recovery curve to the data postbleach. (C) Experimental relationship of the average diffusion coefficient with respect to molecular weight using EGFP (dark gray), 2xEGFP (light gray), and EGFP–α-tubulin (black). Dotted line shows the theoretical expectation for the scaling of the diffusion coefficient with respect to molecular weight. (D) Histogram of individual diffusion coefficient estimates for each treatment condition. (E) Average diffusion coefficient for each treatment condition. Error bars are ± SEM. The p values were obtained by one-way ANOVA. Similar values were obtained from a Kruskal–Wallis test comparing the distributions of D for each condition. In each case, the p values were corrected for multiple comparisons.

