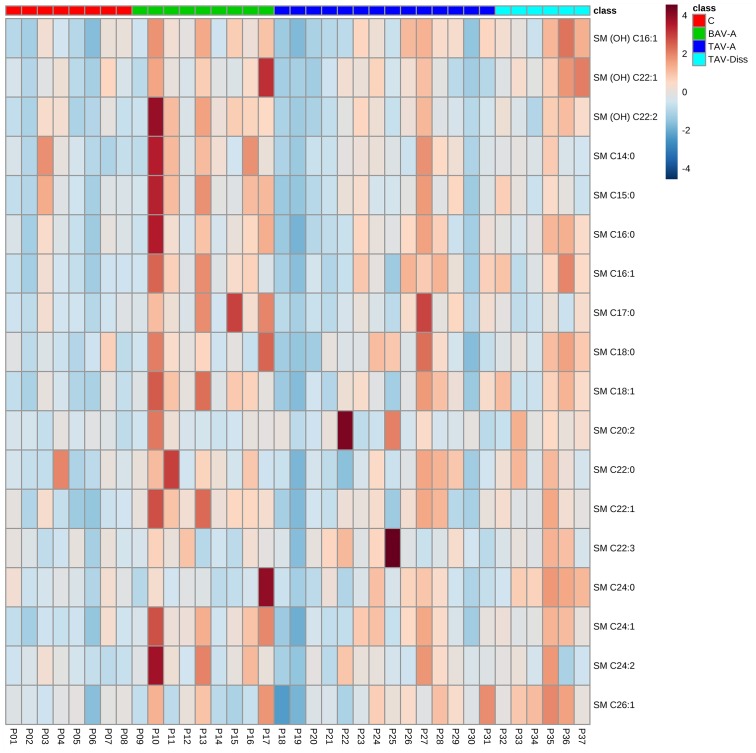
Fig 5. Hierarchical cluster analysis of total sphingomyelin concentrations.
Fig 5 shows the distribution of sphingomyelin concentrations per patient tissue sample by hierarchical cluster analysis. Metabolite identity is indicted on the right side. Colours indicate compound concentrations. Colour scale bar (low concentration (dark blue) to high concentration (dark red) and group colour code are given in the upper right. C, control; BAV-A, bicuspid aortic valve-associated thoracic aneurysm; TAV-A, tricuspid aortic valve-associated thoracic aneurysm; TAV-Diss, tricuspid aortic valve-associated thoracic dissection; SM, sphingomyelin.

