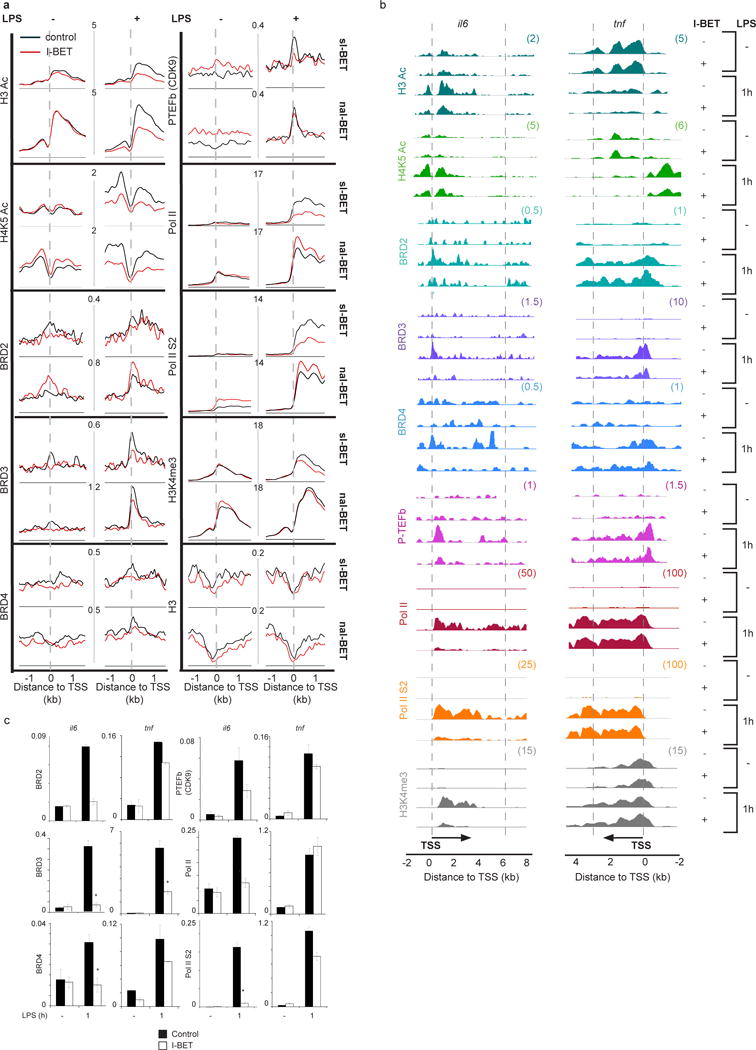
Figure 3. Epigenetic profiles of genes suppressed or unaffected by I-BET in LPS-stimulated macrophages.

a, Genome-wide epigenetic profiles of sI-BET or naI-BET genes in unstimulated or LPS-stimulated (1 hour) macrophages pre-treated with 5 μM of I-BET or a DMSO control. Analyzed epigenetic marks are indicated. Axes represent the number of reads per million mapped reads. b, Epigenetic profiles of il6 and tnf. The y axes represent the average number of tags per gene per 25 bp per 1,000,000 mapped reads. Scale values are indicated in parentheses. c, The abundance of epigenetic marks on il6 and tnf gene promoters was quantified by ChIP qPCR from four (BRD3, BRD4, Pol II and Pol II S2) or two (BRD2 and P-TEFb) independent experiments performed in triplicate. Error bars are s.e.m. of independent experiments or s.d. of representative experiments, respectively. Asterisks indicate p<0.05 as determined by an unpaired T test.
