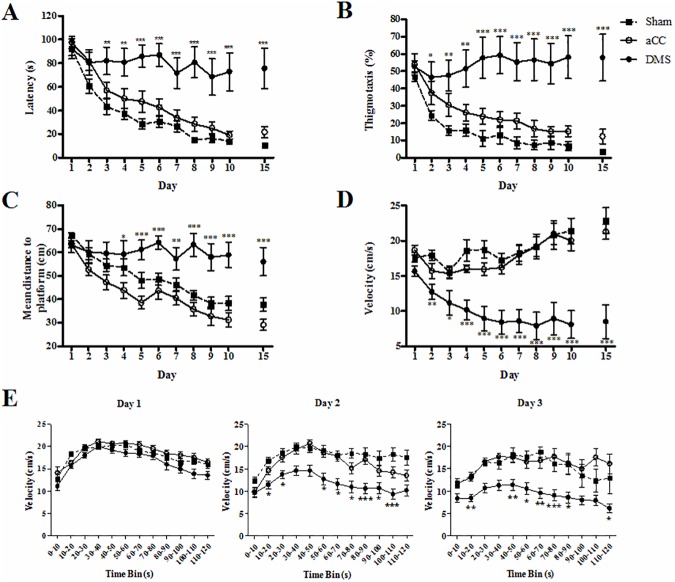
Fig 3. Spatial learning in the Morris water maze test.
Animals with lesions in DMS (n = 9; filled circles, black bar) (A) required significantly more time to locate the hidden platform, (B) spent more time along the walls of the pool, (C) searched further away from the location of the hidden, and (D and E) swam slower from the second day of training compared to sham control group (n = 12; filled squares, grey bar). No overall differences between aCC (n = 11; empty circles, white bar) and sham control group were reported. Represented data are expressed as means ±SEM. * indicates significant differences between the sham control and lesion groups: *p < 0.05, **p < 0.01, ***p < 0.001.

