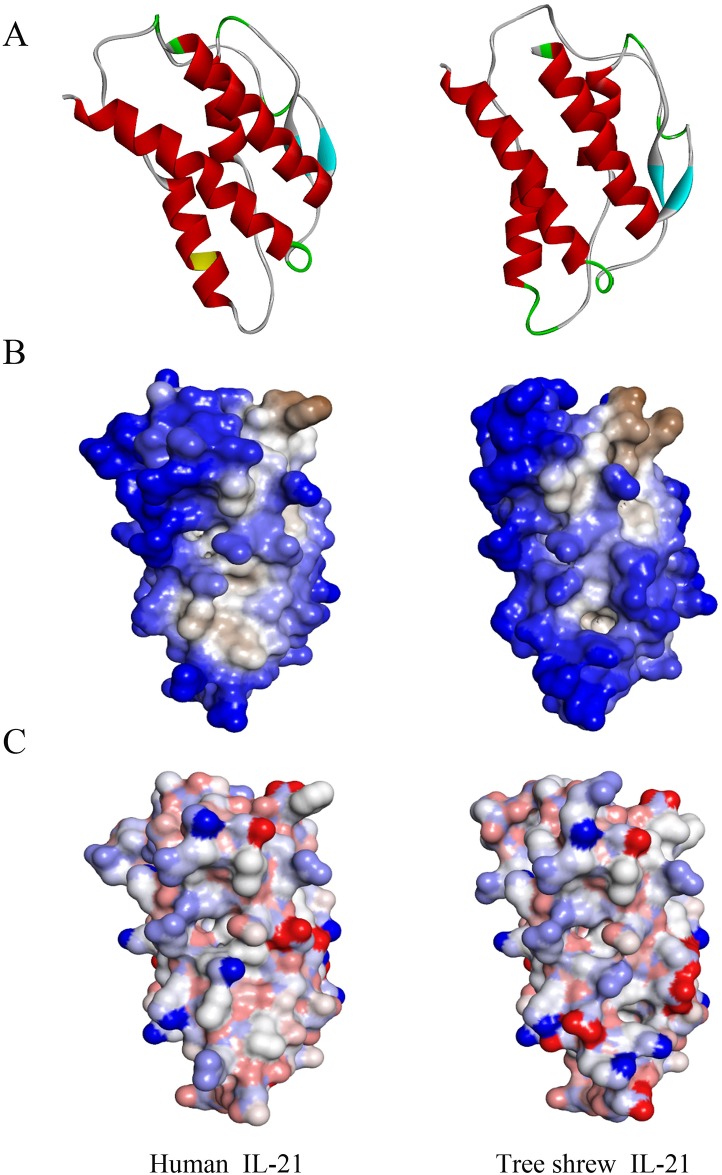
Fig 2. Predicted three-dimensional structures of the tree shrew and human IL-21 protein.
(A) Secondary structure of tree shrew IL-21 (right) compared with human IL-21 (left). Red represents α helices, cyan represents β sheets, green represents β turns, white represents random coils, and yellow represents N-glycosylation sites. (B) Hydrophobicity of tree shrew IL-21 (right) compared with human IL-21 (left). Blue represents hydrophilicity, brown represents hydrophobicity, white represents transition. (C) Surface charge of tree shrew IL-21 (right) compared with human IL-21 (left). Blue represents negative charge, red represents positive charge, white represents no electrical charge.

