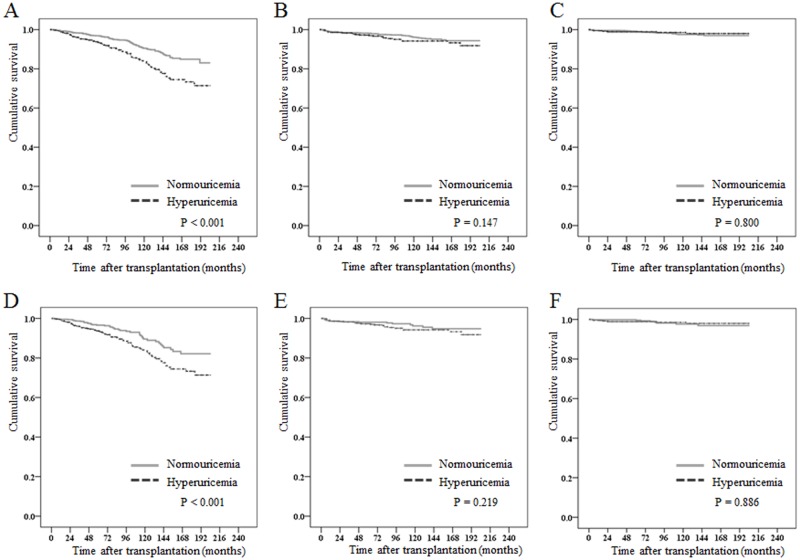
Fig 3. Kaplan-Meier survival curve between normouricemic and hyperuricemic group.
The cumulative risk of graft survival (A), all-cause mortality (B) and ischemic heart disease events (C) in patients with and without hyperuricemia before propensity score matching. Kaplan-Meier curves for the cumulative risk of graft survival (D), all-cause mortality (E) and ischemic heart disease events (F) after propensity score matching.

