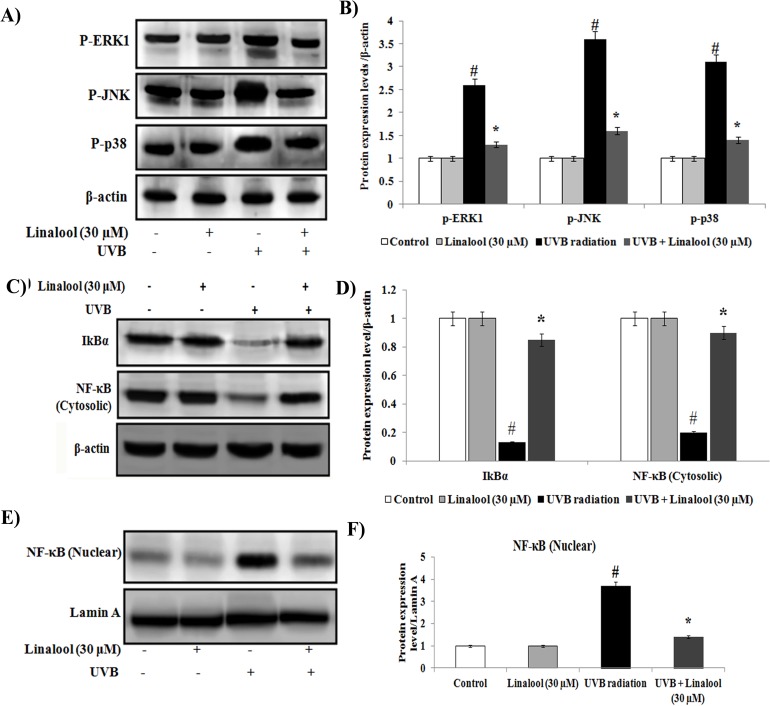
Fig 5. Effect of linalool on UVB-induced MAPKs and NF-κB signaling in HDFa.
(A) Western blot analysis of p-ERK1, p-JNK and p-p38 expression in HDFa. (B) The quantification of protein was performed by densitometric analysis using Image-studio software (LI COR, USA). The densitometry data represent means ± SD from three immunoblots and are shown as relative density of protein bands normalized to ß-actin level. (C) Western blot analysis of cytosolic NF-κB and IκBa expression in HDFa. (D) Band intensities were analyzed by Image studio software and normalized to ß-actin level. (E) Western blot analysis of NF-κB nuclear expression in HDFa. (F) Band intensities were analyzed by Image studio software and normalized to Lamin A level. The densitometry data represent means ± SD from three immunoblots and are shown as relative density of protein bands normalized to Lamin A level. Values not sharing a common marking (# and *) differ significantly at P < 0.05 (DMRT).

