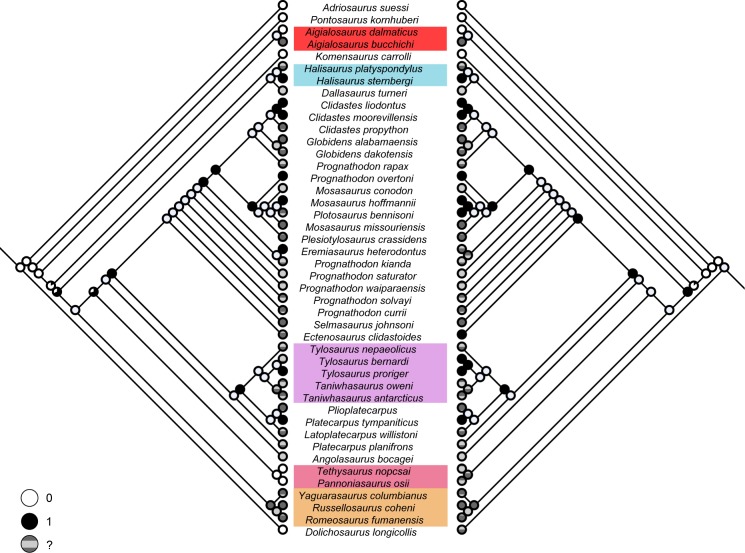
Fig 5. Likelihood ancestral trait reconstruction on the Bayesian MCC tree.
Characters maps indicate evolutionary change of character 117 on the pelvic condition (left) and 123 on the pedal condition (right). White nodes indicate 100% likelihood for state “0”, black nodes indicate 100% likelihood for state “1”, and nodes in shades of gray indicate missing data or ancestral state ambiguity. Nodes with both black and white colors indicate the proportional likelihoods of state “0”(white) and state “1” (black) in a pie chart format.

