Figure 1.

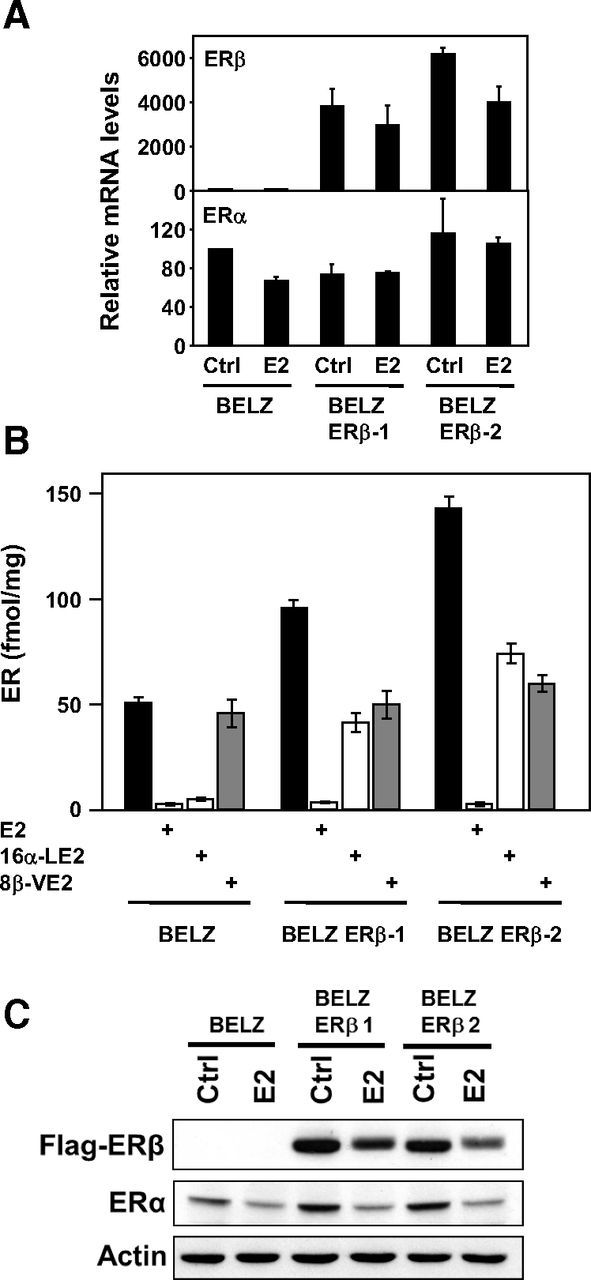
Expression of ERs in BELZ cell lines. A, mRNA quantification. RT-qPCR was performed as described in Materials and Methods in the 3 cell lines, treated (E2) or not (Ctrl) with 10 nM E2. Data are expressed as percent of the value obtained in control BELZ cells. B, Ligand binding assay. Binding of [3H]E2 to ERα and ERβ in the presence or absence of an excess of unlabeled E2 (1 μM), 16α-LE2 (10 nM) or 8β-VE2 (10 nM). Concentrations of ER are expressed in fentamoles/mg of protein. Values are means ± SD of 3 independent experiments. C, Western blot analysis. The levels of ERα and ERβ were quantified by Western blot analysis in BELZ, BELZ ERβ-1, and BELZ ERβ-2 cells, after 1 day of treatment with ethanol (Control) or estrogen (E2 10 nM). Equal loading was validated by measuring actin levels.
