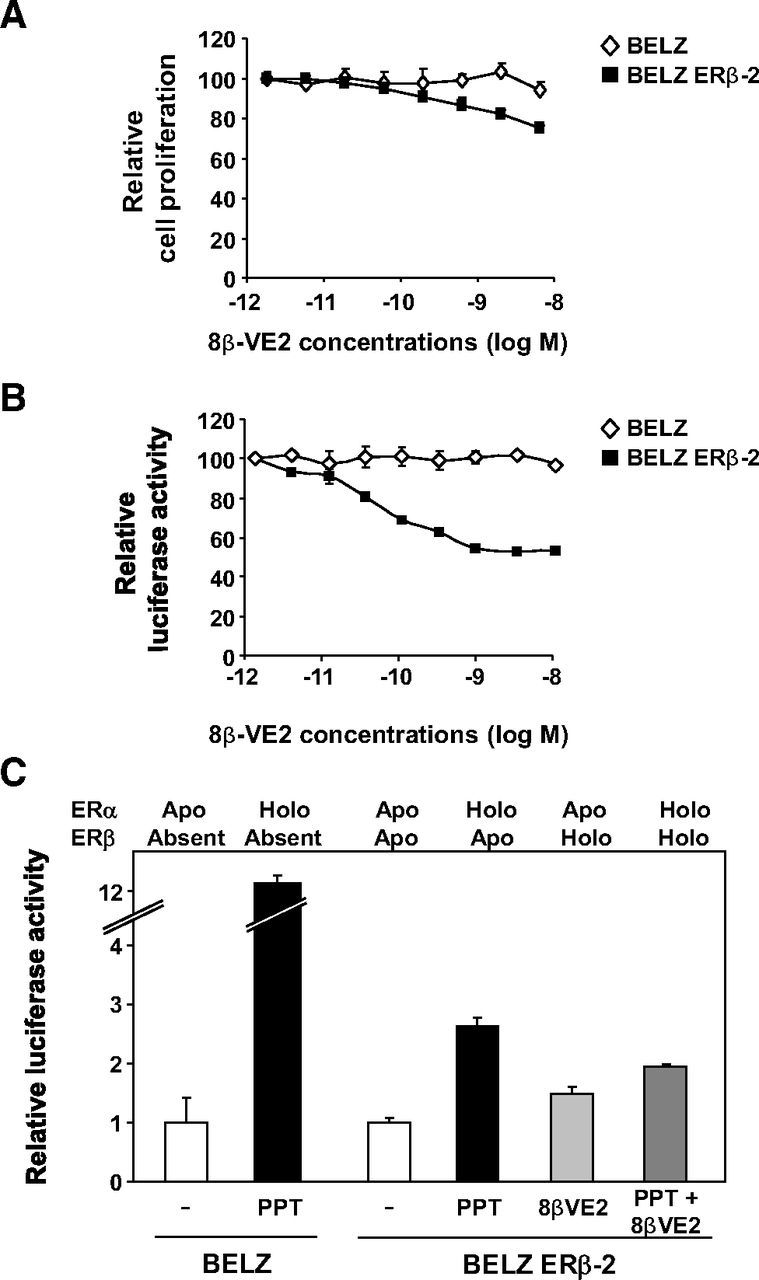
Figure 4.

Transcriptional response of BELZ cells upon sequential activation of both ERs. A, Cell proliferation was quantified in BELZ (♢) and BELZ ERβ-2 (■) cells upon exposure during 7 days to PPT (10 nM) and increasing concentrations of 8β-VE2. Data are presented normalized with respect to the proliferation of control cells set at 100%. B, BELZ (♢) and BELZ ERβ-2 (■) cells were treated with PPT (10 nM) together with increasing concentrations of 8β-VE2. Luciferase activity was quantified as described in Materials and Methods and expressed as percent of control. C, Level of ERE-mediated luciferase activity in the BELZ and BELZ ERβ-2 cell lines treated with the indicated ligands. The status of ER activation (apo or holo status) is indicated. All experiments were performed and data expressed relative to control luciferase activity set at 1.
