Figure 2.
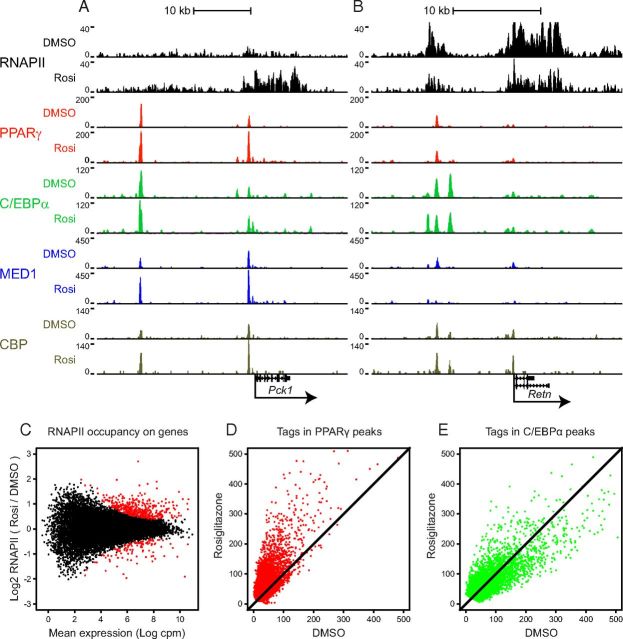
Acute Genome-Wide Effects of Rosiglitazone on Transcription and Binding of PPARγ, C/EBPα, MED1, and CBP in Adipocytes. A and B, ChIP-seq profiles of RNAPII, PPARγ, C/EBPα, MED1, and CBP from 3T3–L1 adipocytes treated with 1 μM rosiglitazone (Rosi) or DMSO for 1 hour are visualized using the UCSC genome browser. Screen shots of (A) the induced gene Pck1 and (B) the repressed gene Retn are shown. The y-axis shows the number of mapped reads at each position along the x-axis. The genomic scales are indicated above the tracks, and the annotated RefSeq gene bodies are indicated below. C, MA plot illustrating difference in gene expression in 3T3–L1 cells treated with rosiglitazone and DMSO. Mapped RNAPII reads from 2 independent biological replicates were counted within RefSeq gene bodies from +250 bp and differential expression was called using edgeR. The y-axis shows the compute fold change in RNAPII occupancy. and the x-axis shows the mean expression in counts per million reads (cpm). Differentially expressed genes are shown in red (FDR < .05). D and E, Scatter plots comparing tag count of PPARγ binding sites (D), and C/EBPα binding sites (E) in 3T3 treated with 1 μM rosiglitazone or DMSO.

