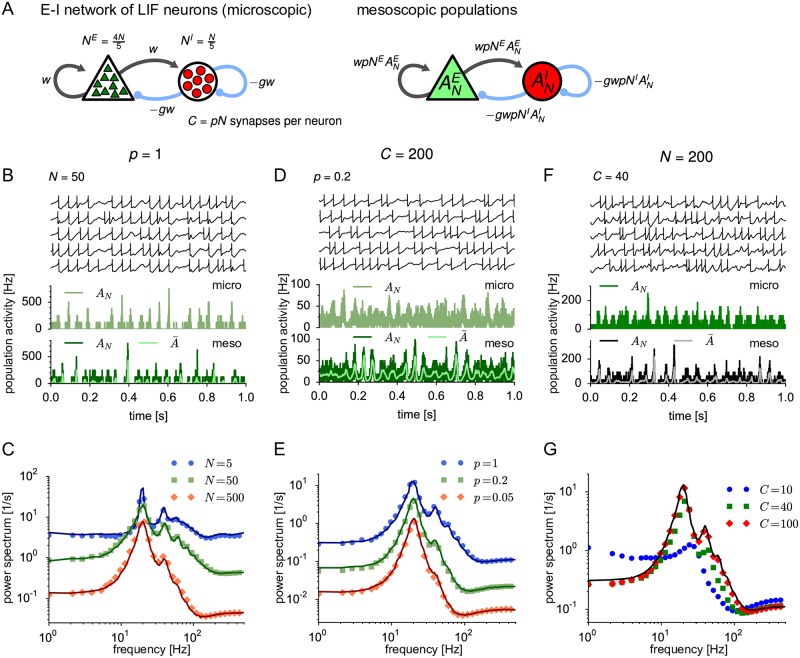
Fig 5. Mesoscopic dynamics of E-I network for varying network size N, connection probability p and number of synapses per neuron C.
(A) Left: Schematic of the network of NE excitatory and NI = NE/4 inhibitory leaky integrate-and-fire (LIF) neurons, each receiving CE = pNE (CI = pNI) connections from a random subset of excitatory (inhibitory) neurons. Total numbers are N = NE + NI and C = CE + CI. At C = 200, the synaptic strength is w = 0.3 mV and −gw = −1.5 mV for excitatory and inhibitory connections, respectively. To preserve a constant mean synaptic input, the synaptic strength is scaled such that Cw = const‥ Right: Schematic of a corresponding mesoscopic model of two interacting populations. (B) Trajectories of u(t) for five example neurons (top) and of the excitatory population activity obtained from the network simulation (middle) and the mesoscopic simulation (bottom, dark green) for C = N = 50; time resolution Δt = 0.2 ms. The light green trajectory (bottom panel) depicts the expected population activity given the past activity. (C) Power spectra of for different network sizes while keeping p = 1 fixed (microscopic: symbols, mesoscopic: solid lines with corresponding dark colors). (D) Sample trajectories corresponding to the green curve in (E) (N = 1000, p = 0.2). (E) Analogously to (C) but varying the connection probabilities while keeping C = pN = 200 fixed. (F) Sample trajectories corresponding to the green curve in (G) (N = 200, C = 40). (G) Analogously to (C) but varying the number of synapses C while keeping N = 200 fixed. Note that the mesoscopic theory (black solid line) is independent of C because the product Cw, which determines the interaction strength in the mesoscopic model (see, left panel of (A)), is kept constant. Parameters: μE/I = 24 mV, mV and θE/I(t) ≡ 0 (no adaptation).

