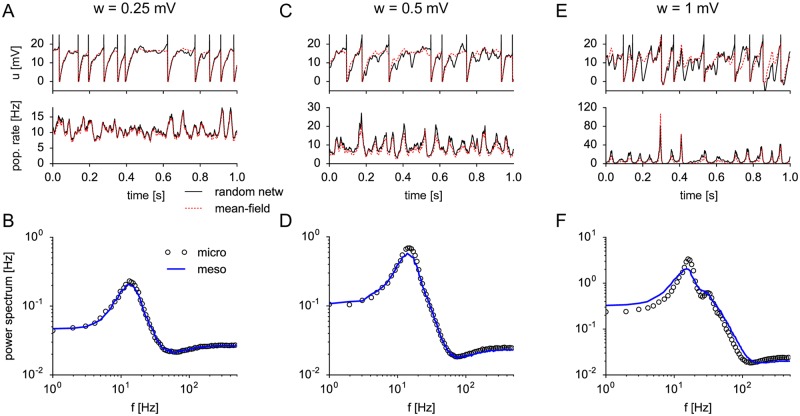
Fig 6. Mean-field approximation of synaptic input for randomly connected networks.
The same E-I network as in Fig 5 with N = 500 neurons and connection probability p = 0.2 was simulated for increasing synaptic strength wEE = wIE = w (wEI = wII = −5w) of excitatory (inhibitory) connections: (A, B) w = 0.25 mV, (C, D) w = 0.5 mV (E, F) w = 1 mV. (A, C, E) Top: Membrane potential of one example neuron shows fluctuations due to spike input from C = 100 presynaptic neurons (black line), which represent a random subset of all 500 neurons. The mean-field approximation of the membrane potential (dashed red line) assumes that the neuron had the same firing times but was driven by all neurons, i.e. by the population activities and , with rescaled synaptic strength . Although individual membrane potentials differ significantly from the mean-field approximation (top), the relevant population-averaged hazard rates (bottom) are well predicted by the mean-field approximation. (B, D, F) Corresponding power spectra of the (excitatory) population activity for microscopic (circles) and mesoscopic (blue solid line) simulation. Parameters as in Fig 5 except μE/I = 18 mV.

