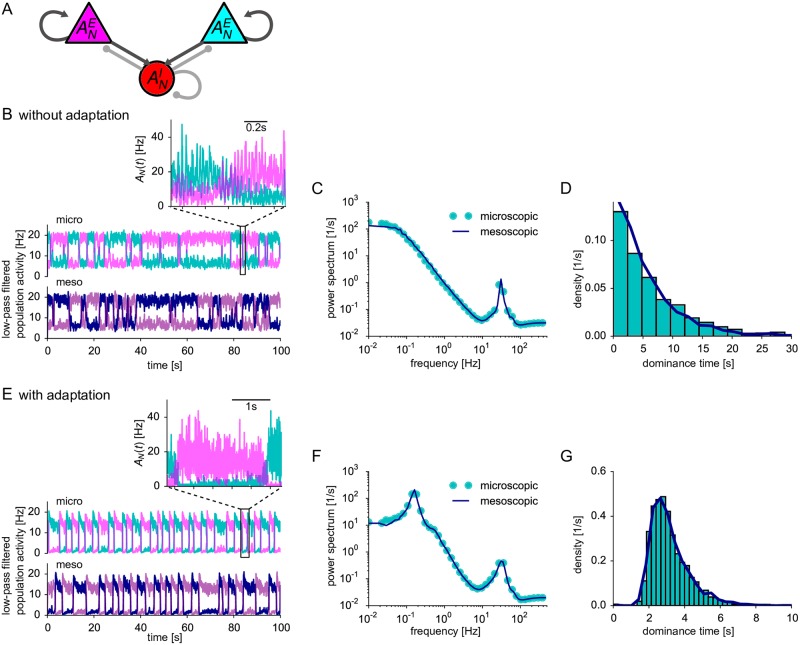
Fig 7. Finite-size induced switching in a bistable network.
(A) Schematic of a winner-take-all network architecture: Two competing excitatory populations (NE1 = NE2 = 400) interact with a common inhibitory population (NI = 200). (B)-(D) In the absence of adaptation (θE/I(t) ≡ 0), the excitatory populations switch between low and high activities in an irregular fashion (B). Activities in (B, E) are low-pass-filtered by a moving average of 100 ms. Top: full network simulation. Inset: Magnified view of the activities for 1 s (without moving average) showing fast large-amplitude oscillations. Bottom: mesoscopic simulation. (C) The power spectrum of the activity of the excitatory populations exhibits large low-frequency power and a high-frequency peak corresponding to the slow stochastic switching between high- and low-activity states and the fast oscillations, respectively. (D) The density of the dominance times (i.e. the residence time in the high-activity states) has an exponential form. (E-G) Like (B-D) but excitatory neurons exhibit weak and slow adaptation ( with Jθ = 0.1 mV⋅s, τθ = 1 s for t ≥ tref). Switching between high- and low-activity states is more regular than in the non-adapting case as revealed by a low-frequency peak in the power spectrum (F) and a narrow, unimodal density of dominance times (G). In (C, D) and (F, G) microscopic and mesoscopic simulation correspond to cyan symbols/bars and dark blue solid lines, respectively. Parameters: μE/I = 36 mV except for μE = 36.5 in (E-G) to compensate adaptation. Time step Δt = 0.01 ms (microscopic), Δt = 0.2 ms (mesoscopic). Efficacies of excitatory and inhibitory connections: wE = 0.0624 mV and wI = −0.2496 mV (B-D), and wE = 0.096 mV and wI = −0.384 mV (E-G), p = 1, mV.

