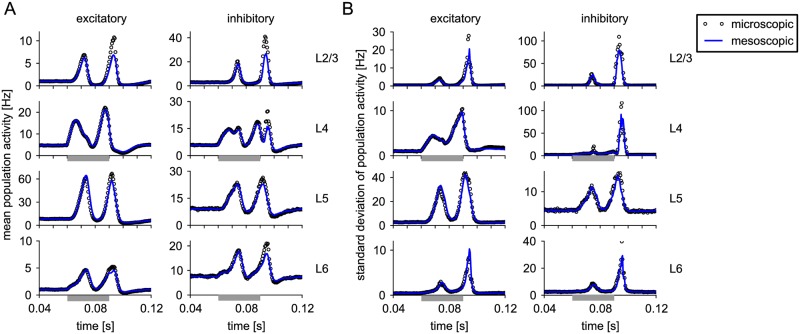
Fig 8. Time-dependent statistics of the population activities in a cortical column model.
(A) Trial-averaged population activities (peri-stimulus-time histogram, PSTH) in the modified Potjans-Diesmann model as illustrated for a single trial in Fig 1. Circles and blue solid line show microscopic simulation (250 trials, simulation time step Δt = 0.01 ms) and mesoscopic simulation (1000 trials, Δt = 0.5 ms), respectively. A step current mimicking thalamic input is provided to neurons in layer 4 and 6 during a time window of 30 ms as indicated by the gray bar. Rows correspond to the layers L2/3, L4, L5 and L6, respectively, as indicated. Columns correspond to excitatory and inhibitory populations, respectively. (B) Corresponding, time-dependent standard deviation of AN(t) measured with temporal resolution Δt = 0.5 ms.

