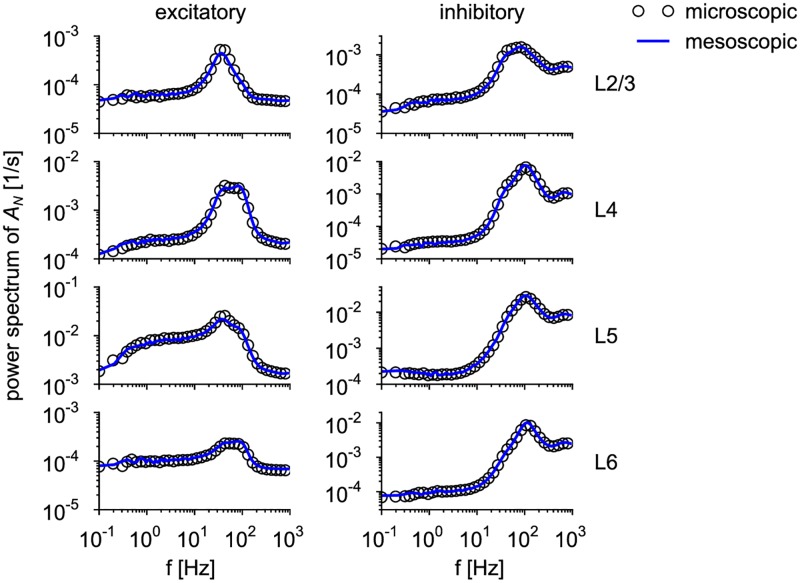
Fig 9. Stationary statistics of population activities in a cortical column model.
Power spectra of the spontaneous population activities AN(t) in the modified Potjans-Diesmann model in the absence of time-dependent thalamic input (corresponding to the activities shown in Fig 1B (microscopic) and Fig 1D (mesoscopic) outside of the stimulation window. Circles and blue solid lines represent microscopic and mesoscopic simulation, respectively. Rows correspond to the layers L2/3, L4, L5 and L6, respectively, as indicated. Columns correspond to excitatory and inhibitory populations, respectively.

