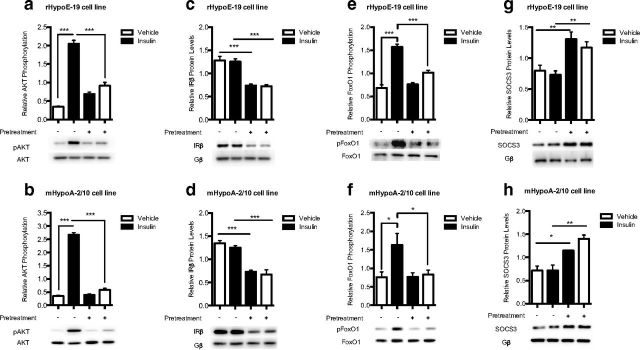
Figure 8.
Effects of chronic insulin treatment on intracellular signaling components of the leptin- and insulin-signaling pathways. rHypoE-19 and mHypoA-2/10 neurons were pretreated with PBS vehicle (−) or 100 nM insulin (+) for 24 hours. The cells were then washed and allowed to recover in fresh medium for 1 hour before a rechallenge with 10 nM insulin or PBS control. Protein was isolated at 15 minutes after treatment and analyzed using Western blot analysis with phospho-specific antibodies against AKT (a and b), IRβ (c and d), FoxO1 (e and f), and SOCS3 (g and h). Protein levels were normalized to total AKT and FoxO1 and G protein (Gβ). Data are shown with SEMs (n = 3–9 independent experiments). **, P < .01; ***, P < .001, as per 1-way ANOVA with a Bonferroni post hoc test.

