
Extended Data Figure 3. Functional decline in aged SCs.
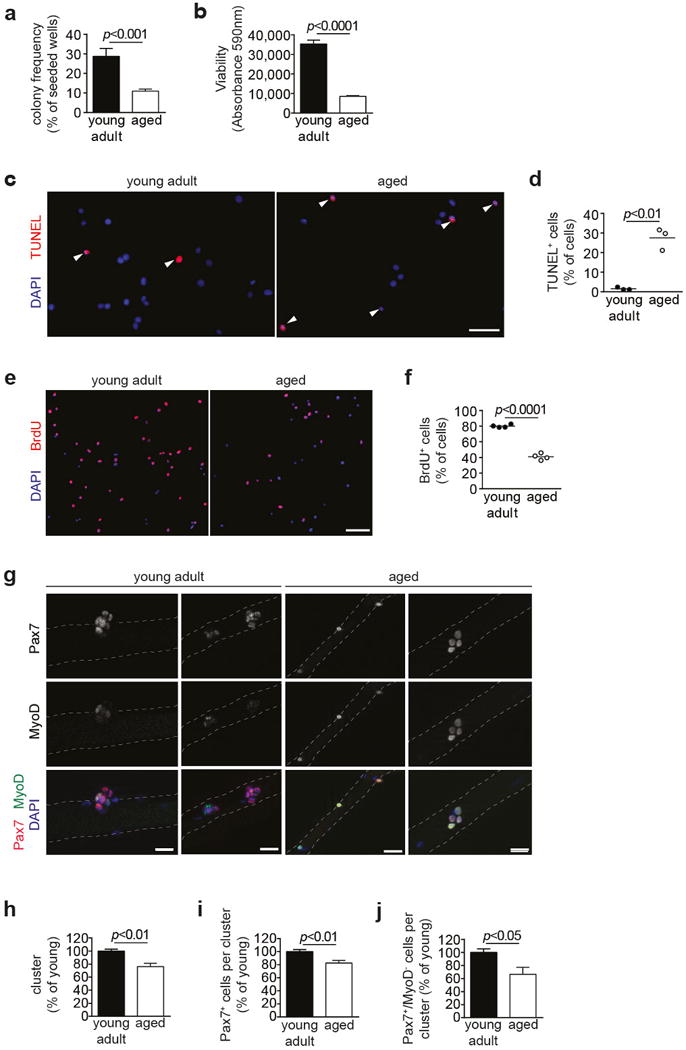
a, SCs from young adult and aged mice were sorted as single cells. After 5d, the frequency of myogenic colonies was assessed. The presence of at least 2 cells was considered as colony. b, Equal numbers of FACS-isolated SCs from young adult and aged mice were cultured for 4d and Alamar Blue assay was performed. c, TUNEL staining of SCs isolated from young adult or aged mice after 4d of culture. Nuclei were counterstained with DAPI (blue). d, Quantification of apoptosis based on TUNEL staining in c. e, BrdU staining of SCs isolated from young adult or aged mice after 4d of culture. Nuclei were counterstained with DAPI (blue). f, Quantification of proliferation based on BrdU staining in e. g, IF staining for Pax7 and MyoD on myofibers isolated from young adult and aged mice after 72h in culture. Nuclei were counterstained with DAPI (blue). h–j, Quantification of the number of SC-derived clusters with at least 3 adjacent cells (h), average number of all Pax7+ cells (i), or proportion of Pax7+/MyoD− cells (j) within clusters as in g. Scale bars = 20 μm for c, g; 50 μm for e. Comparisons by two-sided student’s t-test. n=8 mice (young), n=10 mice (aged) for a; n=7 mice (young), n=5 mice (aged) for b; n=3 mice for d; n=4 mice for f; n=4 mice (aged) for j, n=5 mice (all others) for h–j.