
Extended Data Figure 6. Inhibition of Hoxa9 improves regenerative capacity of aged SCs.
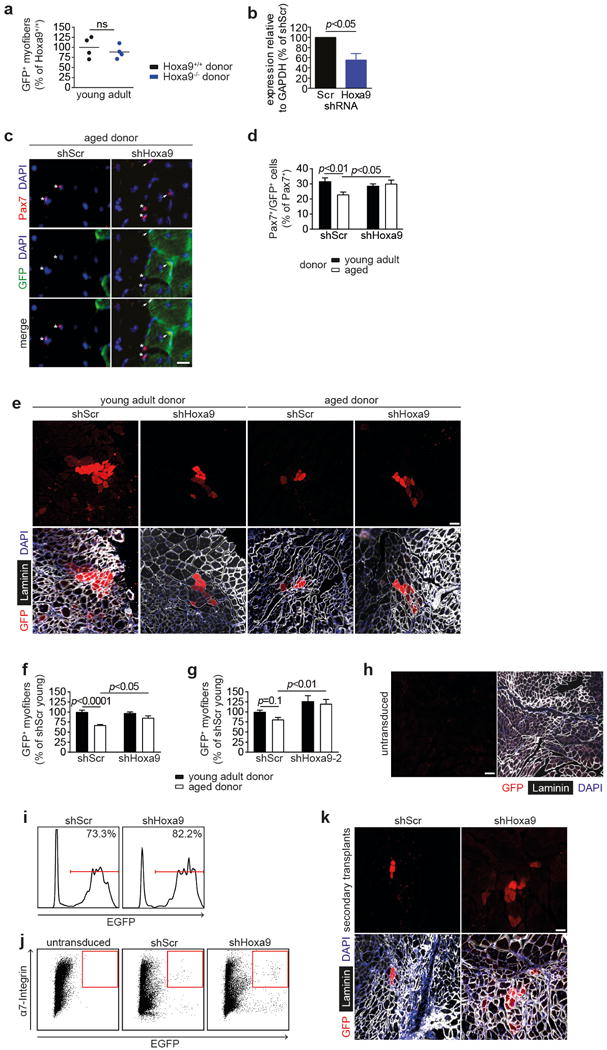
a, Quantification of donor-derived (GFP+) myofibers from transplantation of SCs from young adult Hoxa9+/+ and Hoxa9−/− mice. b, qRT-PCR analysis of Hoxa9 expression in SCs transduced with shHoxa9 or shScr encoding lentivirus. c–g, Transplantation of GFP-labelled SCs from young adult and aged mice that were targeted with an shRNA against Hoxa9 or a scrambled shRNA: (c) IF staining for Pax7 and GFP of transplanted muscle sections. Nuclei were counterstained with DAPI (blue). Arrowheads denote Pax7+/GFP+ cells, asterisks label Pax7+/GFP− cells; (d) Quantification of donor-derived (GFP+) Pax7+ cells in c; (e) IF staining for GFP and Laminin of transplanted muscle sections, nuclei were counterstained with DAPI (blue); (f–g) Quantification of donor-derived (GFP+) myofibers in e for two different Hoxa9 shRNAs in two independent experiments. h, IF staining for GFP and Laminin in TA muscles engrafted with untransduced aged SCs. Nuclei were counterstained with DAPI (blue). i, Flow-cytometric analysis of transduction efficiency of donor SCs used for transplantation in primary donors analyzed in Fig. 2f. j, Representative flow-cytometry plots for re-isolation of transplanted aged SCs that were untransduced as control or transduced with shScr or shHoxa9 encoding lentivirus as quantified in Fig. 2f. k, IF staining for GFP and Laminin in engrafted TA muscles from secondary recipients quantified in Fig. 2g. Nuclei were counterstained with DAPI (blue). Scale bars = 20 μm for c; 50 μm for h; 100 μm for e, k. Comparisons by two-sided student’s t-test (a–b) or two-way ANOVA (d, f–g). n=4 recipient mice for a; n=3 mice for b; n=6 recipient mice (young donors), n=4 recipient mice (aged donors) for d, f; n=5 recipient mice for g.