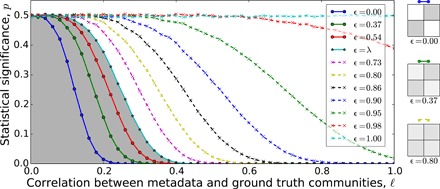
Fig. 2. Expected P value estimates of the blockmodel entropy significance test as the correlation ℓ between metadata and planted communities increases (each metadata label correctly reflects the planted community with probability (1 + ℓ)/2; see Supplementary Text B).

Each curve represents networks with a fixed community strength ϵ = ωrs/ωrr. Solid lines indicate strong community structure in the so-called detectable regime (ϵ < λ), whereas dashed lines represent weak undetectable communities (ϵ > λ) (8). Three block density diagrams visually depict ϵ values.
