. 2017 May 3;6:e23966. doi: 10.7554/eLife.23966

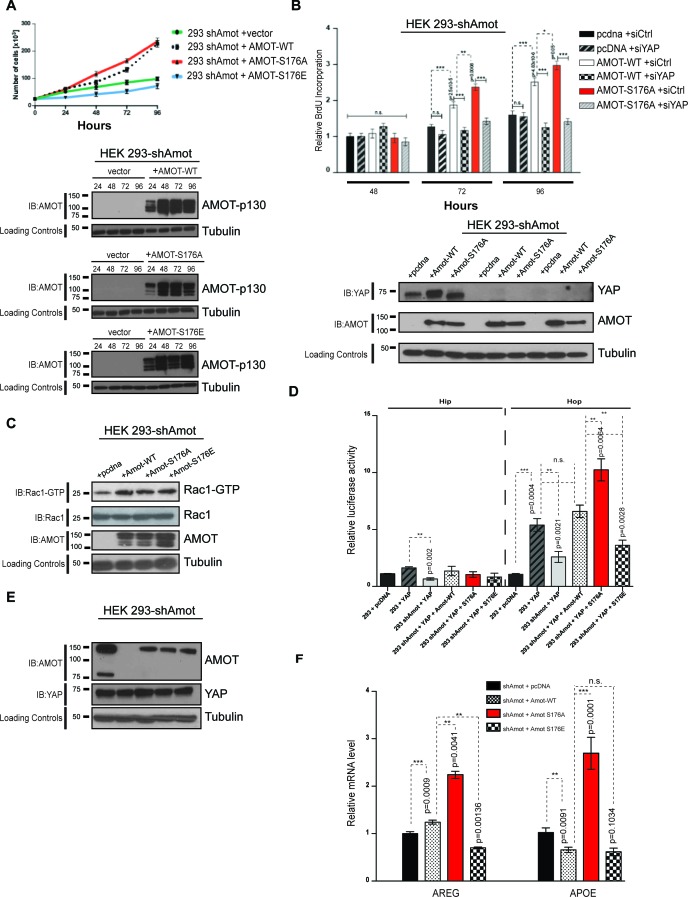
Figure 6. AmotS176A promotes the proliferative and transcriptional activities of YAP.

(A) AmotS176 regulates cellular proliferation. HEK293-shAmot cells were transiently transfected with indicated expression plasmids and total cell numbers were counted over 4 days. Means of each data point were calculated from three independent biological replicates conducted in triplicate. Error bars represent ±S.D. Immunoblot analysis was used to verify the transfection efficiency of the indicated Amot-p130 constructs. Tubulin was used as a loading control. The blots shown are representative of three biological replicates. (B) Amot expression drives proliferative phenotype that is YAP-dependent. HEK293-shAmot cells were co-transfected with the indicated expression plasmid and either a SMARTpool of siRNAs targeting YAP or a non-targeting control (siCtr). Levels of BrdU incorporation compared to HEK293-shAmot+pcDNA+siCtr (set to 1) were determined 48 hr, 72 hr, and 96 hr post co-transfection for all the conditions. Means were calculated from three biological replicates conducted in triplicate. Error bars represent ±S.D. Individual pairwise comparisons were assessed by Student's t-test, *p<0.05; **p<0.01; ***p<0.001; n.s. – non-significant. Exact p-values are indicated in the figure. Immunoblot analysis to confirm efficient knockdown of YAP using two independent siRNAs (siYAP-A and siYAP-B) (see Figure S6) and efficient overexpression of the indicated Amot-p130 constructs in HEK293-shAmot cells. Tubulin was used as a loading control. The blots shown are representative of three biological replicates (n = 3). (C) Amot-p130 serine 176 does not affect Rac1 activation. IB analysis of cell lysates from HEK293-shAmot cells expressing Amot-WT, Amot-p130S176A or Amot-p130S176E with anti-Rac1-GTP, anti-Rac1 and anti-Amot antibodies as indicated. Tubulin was used as a loading control. Cells were serum starved overnight and stimulated with 10 ng/mL EGF for 5’. The blots shown are representative of three biological replicates (n = 3). (D) AmotS176 status regulates YAP transcriptional activity. HEK293 and HEK293-shAmot cells were transfected with indicated constructs and HIP-flash or HOP-flash reporters. Reporter’s firefly luciferase activity was normalized to the levels of Renilla luciferase used as an internal control. The means of luciferase activity were calculated from three biological replicates conducted in quadruplicate. Error bars represent ±S.D. Individual pairwise comparisons were assessed by Student's t-test, **p<0.01; ***p<0.001; n.s. – non-significant. Exact p-values are indicated in the figure. (E) Immunoblot analysis showing efficient transfection of Amot-p130, Amot-p130 mutants, and YAP in cell lysates used in (D). Tubulin was used as a loading control. The blots shown are representative of three biological replicates. (F) AmotS176 status regulates expression of endogenous YAP targets. Expression of the YAP target genes Areg and ApoE was probed in HEK293-shAmot cells expressing Amot-WT, Amot-p130S176A or Amot-p130S176E by quantitative real-time PCR. mRNA levels were compared with the empty vector control (set to 1). Means were calculated from Ct values in three independent biological replicates conducted in triplicate. GAPDH was used to normalize for variances in input cDNA. See Table 1. Error bars represent ±S.D. Individual pairwise comparisons were assessed by Student's t-test, **p<0.01; ***p<0.001; n.s. – non-significant. Exact p-values are indicated in the figure.

DOI: http://dx.doi.org/10.7554/eLife.23966.015

Figure 6—source data 1. Cell counts for HEK293 cells, treated as described Figure 6A.
DOI: 10.7554/eLife.23966.016

Figure 6.

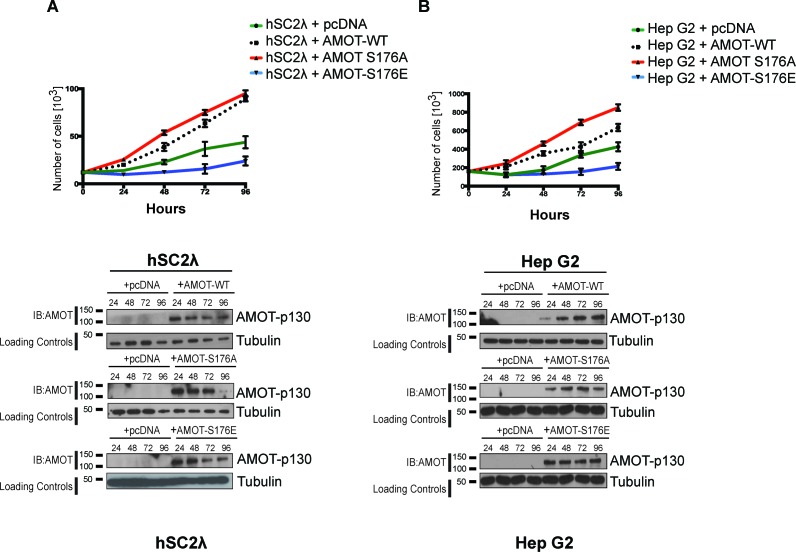
Figure 6—figure supplement 1. AmotS176A promotes proliferation of human Schwann and hepatocellular carcinoma cells.

Figure 6—figure supplement 1.

(A) hSC2λ or (B) HepG2 cells were cells were transiently transfected with indicated expression plasmids and total cell numbers were counted over 4 days (top). Means of each data point were calculated from three independent biological replicates conducted in triplicate. Error bars represent ±S.D. Immunoblot analysis was used to verify the transfection efficiency of the indicated Amot-p130 constructs (bottom). Tubulin was used as a loading control. The blots shown are representative of three biological replicates.
Figure 6—figure supplement 1—source data 1. Cell counts for hSCλ cells, treated as described in Figure 6—figure supplement 1.
DOI: 10.7554/eLife.23966.018
Figure 6—figure supplement 1—source data 2. Cell counts for hSCλ cells, treated as described Figure 6—figure supplement 1.
DOI: 10.7554/eLife.23966.019
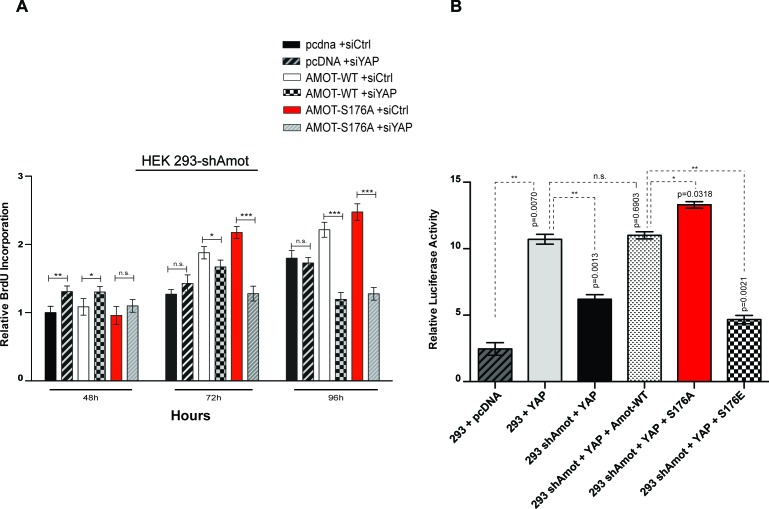
Figure 6—figure supplement 2. Amot-p130S176 pro-proliferative phenotype is YAP dependent and regulates YAP transcriptional activity.

Figure 6—figure supplement 2.

(A) HEK293-shAmot cells were co-transfected with the indicated plasmid DNAs and siRNAs. Fold variation of BrdU incorporation compared to HEK293-shAmot+pcDNA+siCtr (set to 1) was determined 48 hr, 72 hr, and 96 hr post co-transfection for all the conditions. Means were calculated from three independent biological replicates conducted in triplicate (n = 9). Error bars represent ±S.D. (n = 9). Individual pairwise comparisons were assessed using Student's t-test, *p<0.05; **p<0.01; ***p<0.001; n.s. – non-significant. (B) HEK293 and HEK293-shAmot cells were transfected with indicated constructs and GTIIC-luc reporter. Reporter luciferase activity was normalized to levels of Renilla luciferase used as an internal reporter control. Means of luciferase activity were calculated from three independent biological replicates conducted in quadruplicate (n = 12). Error bars represent ±S.D. Individual pairwise comparisons were assessed using Student's t-test, *p<0.05; **p<0.01; ***p<0.001; n.s. – non-significant. Exact p-values are indicated in the figure.
Figure 6—figure supplement 2—source data 1. Counts for BrdU incoporation.
Cells treated as described in Figure 6—figure supplement 2A.
DOI: 10.7554/eLife.23966.021
Figure 6—figure supplement 2—source data 2. Counts for luciferase activity.
Cells treated as described in Figure 6—figure supplement 2B.
DOI: 10.7554/eLife.23966.022
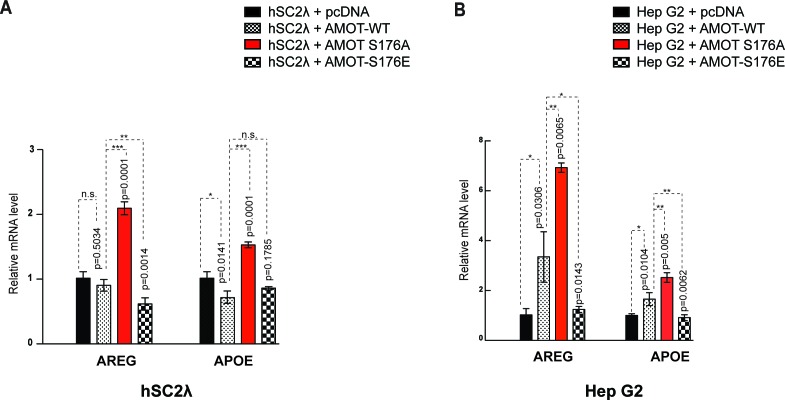
Figure 6—figure supplement 3. Amot-p130S176 regulates YAP transcriptional activity.

Figure 6—figure supplement 3.

Expression of the YAP target genes Areg and ApoE was assessed by quantitative real-time PCR in (A) hSC2λ or (B) HepG2 cells co-transfected with the indicated plasmid DNAs and siRNAs. Areg and ApoE mRNA levels were compared with the empty vector control (pCDNA, set to 1). Means were calculated from Ct values in three independent biological replicates conducted in triplicate. GAPDH was used to normalize for variances in input cDNA. See Table 1. Error bars represent ±S.D. Individual pairwise comparisons were assessed by Student's t-test, **p<0.01; ***p<0.001; n.s. – non-significant. Exact p-values are indicated in the figure.
Figure 6—figure supplement 3—source data 1. Source data for qPCR analysis of AREG expression in hSC-lambda cells.
Analysis as described in Figure 6—figure supplement 3.
DOI: 10.7554/eLife.23966.024
Figure 6—figure supplement 3—source data 2. Source data for qPCR analysis of APOE expression in hSC-lambda cells.
Analysis as described in Figure 6—figure supplement 3.
DOI: 10.7554/eLife.23966.025
Figure 6—figure supplement 3—source data 3. Source data for qPCR analysis of AREG expression in HepG2 cells.
Analysis as described in Figure 6—figure supplement 3.
DOI: 10.7554/eLife.23966.026
Figure 6—figure supplement 3—source data 4. Source data for qPCR analysis of APOE expression in HepG2 cells.
Analysis as described in Figure 6—figure supplement 3.
DOI: 10.7554/eLife.23966.027