. 2017 Apr 17;6:e24241. doi: 10.7554/eLife.24241

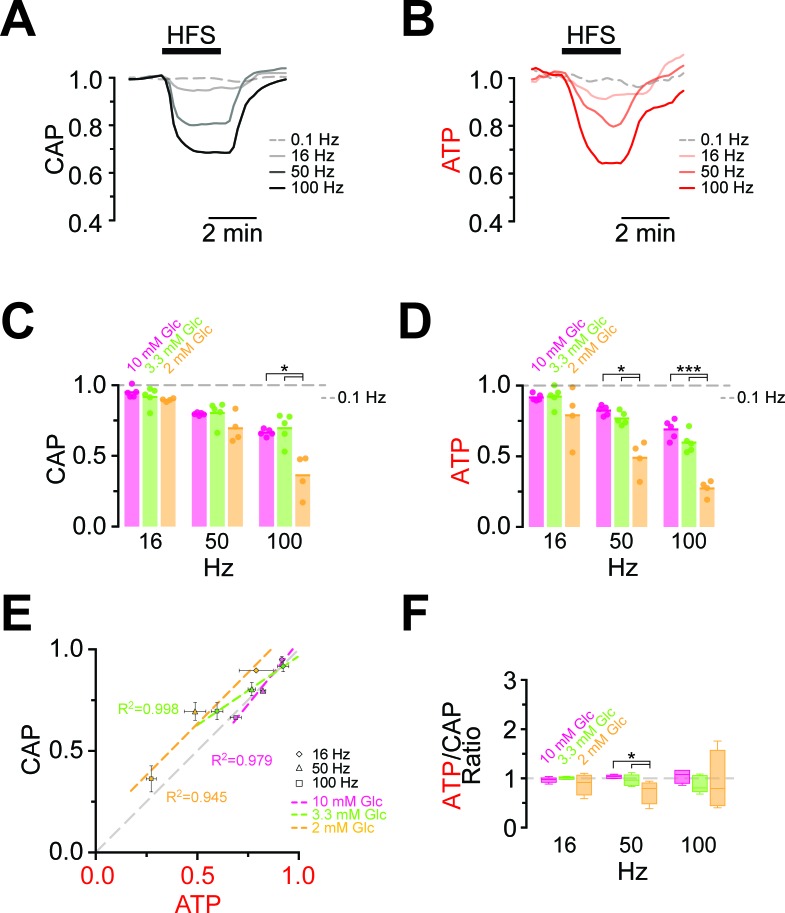
Figure 4. Comparison of ATP and CAP dynamics during high frequency stimulation.

(A) The CAP area decreases over time during high-frequency stimulation (HFS). The decay amplitude deviates from the absence of HFS, indicated by the dashed line (0.1 Hz, used for normalization to 1.0), and increases progressively with the increase in stimulation frequency (16 Hz, 50 Hz, 100 Hz). Traces from one representative nerve incubated in aCSF containing 10 mM glucose are shown. (B) Axonal ATP levels also decrease with increasing stimulation frequency, reaching a new steady state level which depends on the stimulation frequency. Same experiment as in panel A. (C) Remaining CAP area at the end of the HFS (overall decay amplitude) during incubation of nerves in different glucose concentrations quantified during the last 30 s of HFS. The stripe plot shows summarized data from n = 5, 5, or 4 nerves for 10 mM, 3.3 mM and 2 mM glucose, respectively. The dashed line at 1 shows CAP size at 0.1 Hz stimulation frequency, which was used for normalization. (D) Quantification of ATP decay amplitude during incubation of the same nerves as in (C) in different glucose concentrations. The dashed line at 1 shows ATP levels at 0.1 Hz stimulation frequency. (E) Correlation of the amplitude of ATP and CAP decay during HFS of nerves bathed in aCSF containing the glucose concentrations indicated. Data points are very close to the diagonal of the graph indicating that ATP and CAP change by similar factors. (F) Ratio of ATP and CAP drop during HFS in the presence of glucose in the concentrations indicated. If both parameters change by the same factor, this ratio remains equal to one. Data in (C–D) is presented as stripe plots, with dots representing individual data points and bars and lines showing the mean. Asterisks indicate statistically significant differences between glucose concentrations (*p<0.05, ***p<0.001; Welch’s t-test).

DOI: http://dx.doi.org/10.7554/eLife.24241.010

Figure 4—source data 1. Table containing data for Figure 4.
This xlsx-data file contains the data shown in Figure 4C,D,F and Figure 4—Figure supplement 5.
DOI: 10.7554/eLife.24241.011

Figure 4.

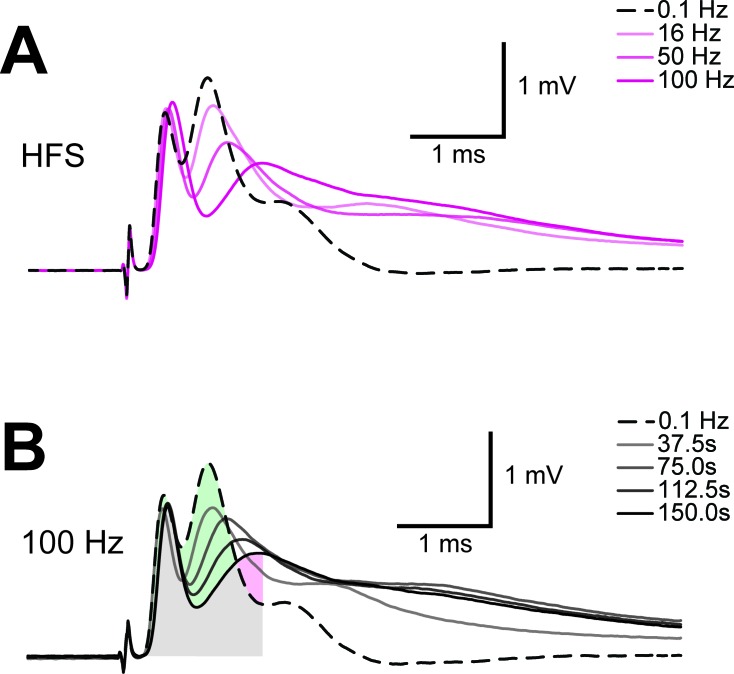
Figure 4—figure supplement 1. Example of progression of CAP traces’ decay during high frequency stimulation (HFS).

Figure 4—figure supplement 1.

(A) The three peaks recognizable in the baseline trace (dashed line) are differently affected by increasing stimulation frequency and for CAP analysis only the first two are considered. Shown are single traces obtained prior to stimulation (baseline) as well as at the end of a 2.5 min stimulation period at different stimulation frequencies (16 Hz, 50 Hz, 100 Hz) of a nerve incubated in aCSF containing 10 mM glucose. (B) Example of progression of CAP from baseline (dashed line) during stimulation of an optic nerve at 100 Hz incubated in aCSF containing 10 mM glucose for a total stimulation time of 2.5 min. Single traces are separated by 37.5 s. The shaded area indicates the area under the CAP wave form used for CAP quantification for the baseline condition (green) and after 150 s of HFS (red). Grey shading results from the overlay of green and red shading.
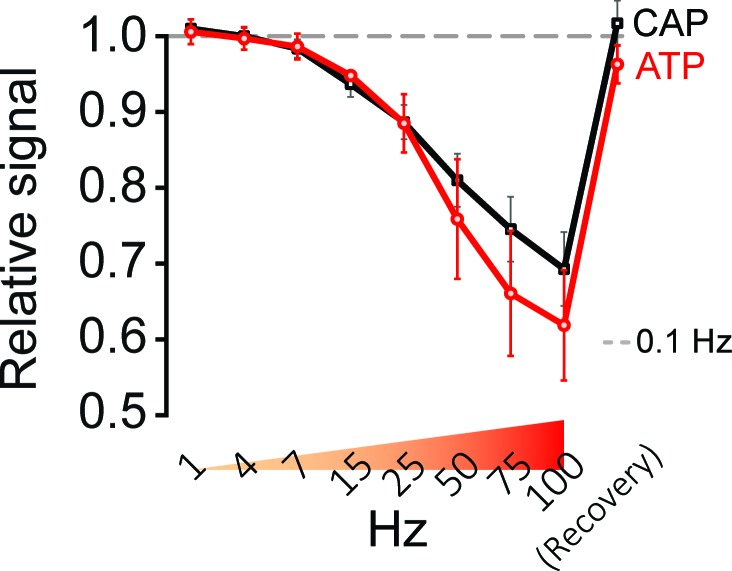
Figure 4—figure supplement 2. Stimulation of optic nerves with progressively increasing frequencies.

Figure 4—figure supplement 2.

Frequency-dependent changes in relative signal amplitude of ATP and CAP, during progressively increasing stimulation frequencies (1 Hz to 100 Hz) and following recovery. Nerves incubated in aCSF containing 10 mM glucose were stimulated for 45 s each with the indicated frequencies, directly followed by stimulation with the next higher frequency. The dashed line at 1.0 shows ATP and CAP values at 0.1 Hz stimulation frequency, which are used for respective normalization (n = 4 nerves).
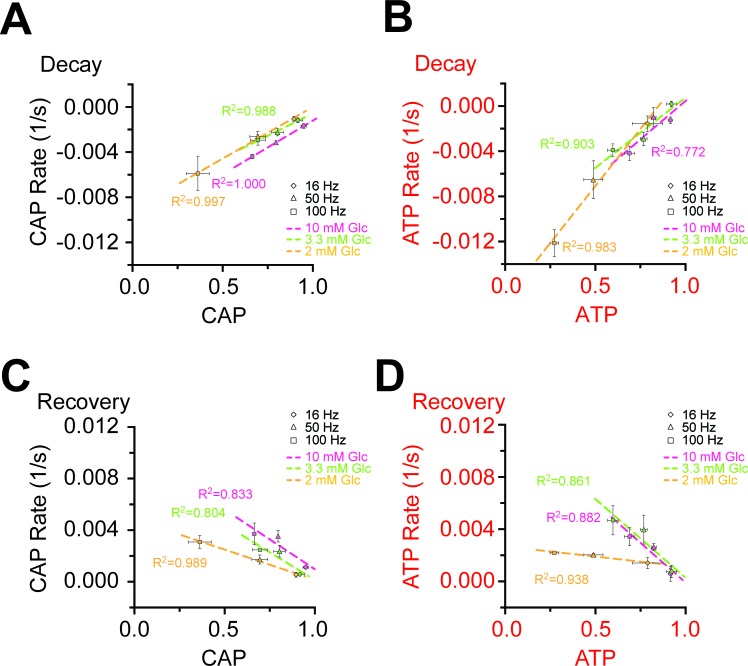
Figure 4—figure supplement 3. Correlation of the rates and amplitudes of CAP and ATP changes during HFS in different glucose concentrations.

Figure 4—figure supplement 3.

(A) Correlation of the velocity of the initial decay of CAP at the beginning of HFS and the amplitude of CAP decay at the end of HFS. The faster the CAP drops, the larger the CAP amplitude is. (B) Same analysis for ATP as for CAP area in panel A. Also a faster ATP consumption at the beginning of HFS coincides with a larger decrease in ATP signal amplitude. (C) Correlation of the rates of CAP area recovery after the cessation of stimulation and the amplitudes of CAP changes at the end of the stimulation at different glucose concentrations. The velocity of CAP recovery increases with larger amplitude of CAP decay during stimulation. (D) Same analysis as in C for ATP. ATP recovery rates are strongly depending on the amplitude of ATP decrease during HFS at 10 mM and 3.3 mM glucose, but much less in the presence of 2 mM glucose. The graphs summarize data from n = 5, 5, or 4 nerves for 10 mM, 3.3 mM and 2 mM glucose, respectively.
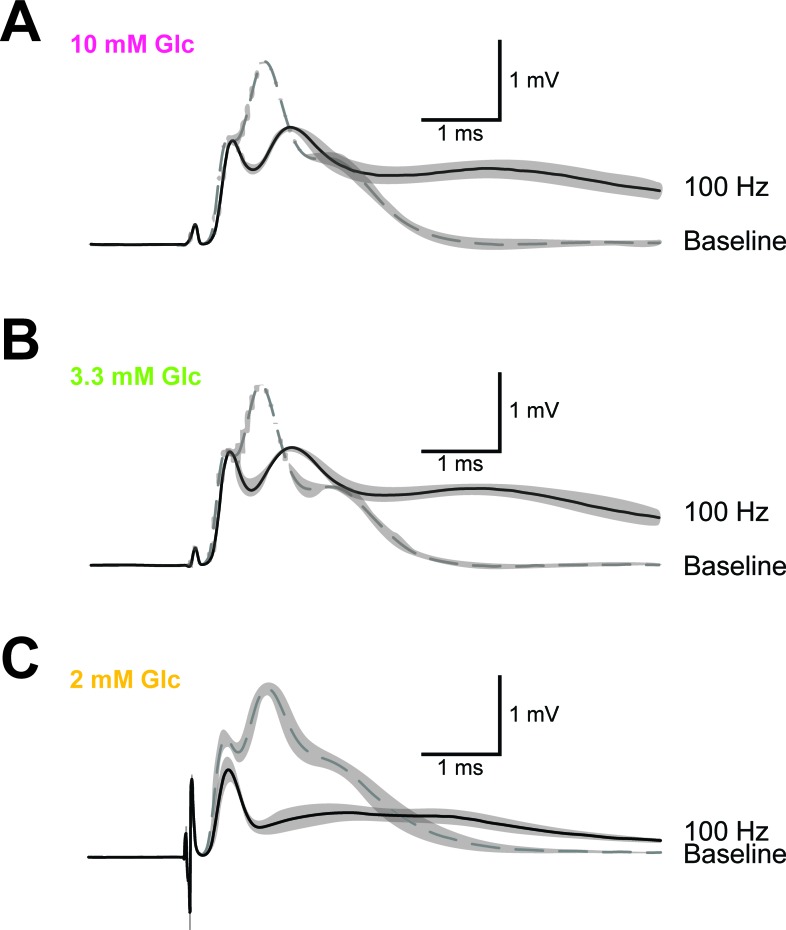
Figure 4—figure supplement 4. Example of CAP traces before and after high-frequency stimulation (HFS) of optic nerves incubated in aCSF with different concentrations of glucose.

Figure 4—figure supplement 4.

Shown are mean CAP wave forms (n = 3 nerves for each condition) incubated in aCSF containing 10 mM glucose (A), 3.3 mM glucose (B) and 2 mM glucose (C) prior to high- frequency stimulation (‘baseline’; dashed lines) or at the end of the 2.5 min HFS (100 Hz) period (solid lines). Grey areas indicate SEM.
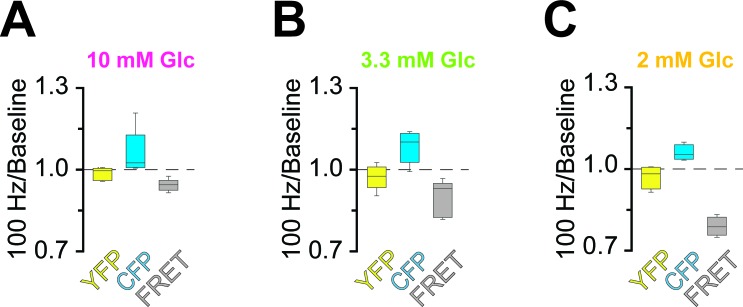
Figure 4—figure supplement 5. Analysis of fluorescence changes of the ATP sensor during high-frequency stimulation (HFS) of optic nerves incubated in aCSF with different concentrations of glucose.

Figure 4—figure supplement 5.

Changes of the fluorescence signal at the end of the 2.5 min HFS (100 Hz) period relative to the baseline signal prior to stimulation of optic nerves incubated in aCSF containing 10 mM glucose (A), 3.3 mM glucose (B) and 2 mM glucose (C). During HFS, fluorescence in the CFP channel increased, while fluorescence in the FRET channel decreased. Of note, YFP emission upon direct YFP excitation remains stable. n = 5, 5, 4 nerves for 10 mM, 3.3 mM and 2 mM glucose, respectively.