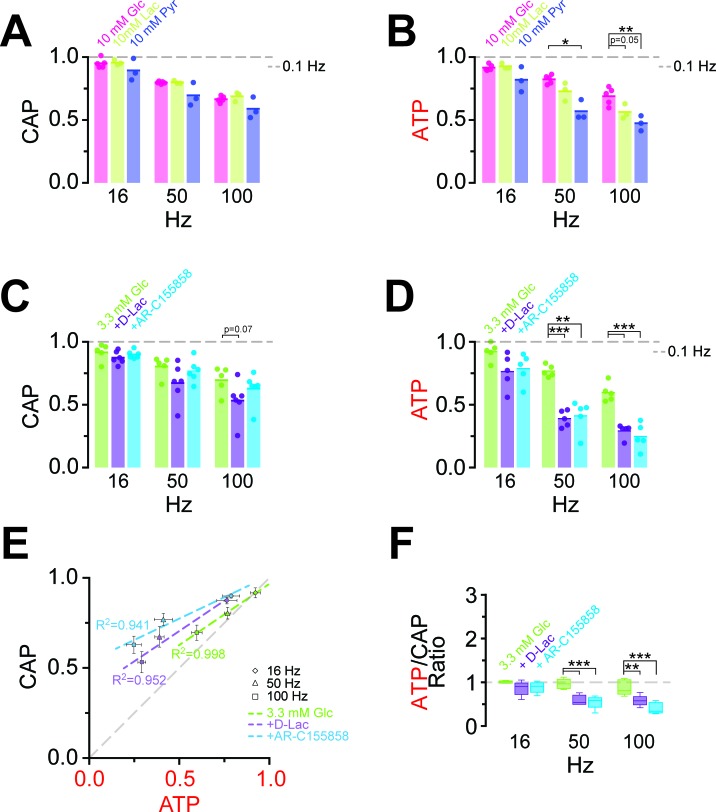
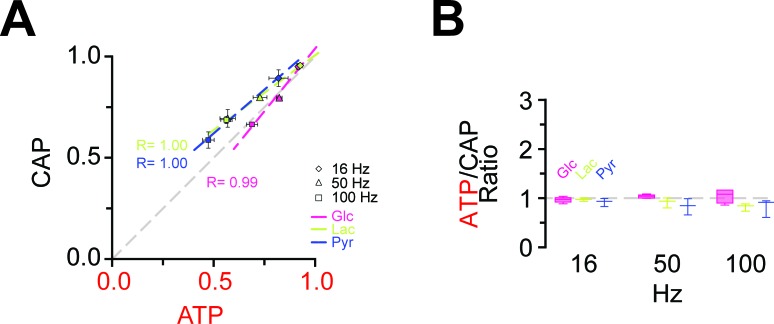
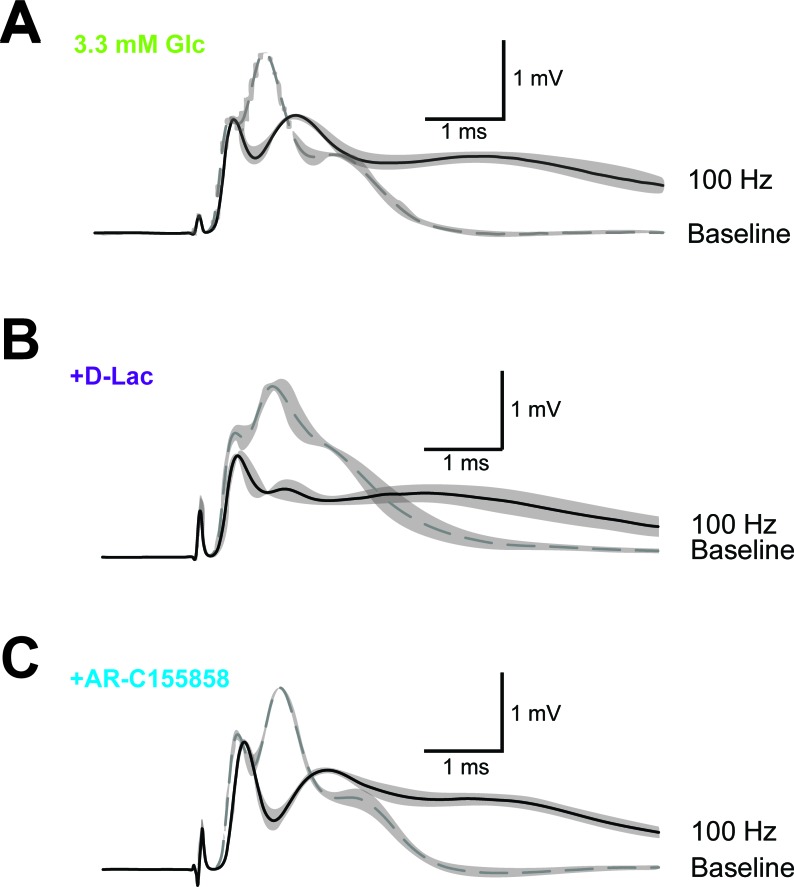
Figure 5. Energy metabolism of optic nerves depends on the type and concentration of substrates and involves lactate metabolism.
(A) The comparison between CAP area decay of optic nerves incubated in 10 mM glucose aCSF (n = 5 nerves) versus optic nerves incubated either in 10 mM lactate or 10 mM pyruvate (n = 3 nerves) during HFS, shows no significant differences among the three substrates (p>0.05, Welch’s t test). (B) In contrast, analysis of axonal ATP levels shows that at higher frequencies glucose is a better substrate to maintain axonal ATP levels. Same experiments as in panel A. (C) In the presence of glucose (3.3 mM; n = 5 nerves) as exogenous energy substrate, inhibition of lactate metabolism by D-lactate (20 mM; competitive inhibitor of endogenous L-lactate metabolism at MCTs and LDH, n = 6) or AR-C155858 (10 µM; MCT1 and MCT2 selective inhibitor, n = 6) does not significantly affect CAPs. (D) Analysis of ATP under the same conditions as in (C): ATP levels undergo a strong decrease at higher frequencies in the presence of D-lactate or AR-C155858. (n = 5 nerves for all conditions). The dashed lines in panels A–D at 1 show CAP size or ATP levels at 0.1 Hz stimulation frequency used for normalization. (E) Inhibition of metabolism of endogenously produced L-lactate in the presence of glucose as the sole exogenous energy substrate shifts the correlation of ATP and CAP to the upper left showing that ATP changes more strongly than CAP. (F) The ratio of ATP and CAP drop decreases significantly in the presence of inhibitors of lactate metabolism, confirming that ATP changes more strongly than CAP. Asterisks in (A–D and F) indicate significant differences among conditions: *p<0.05, **p<0.01, ***p<0.001; Welch’s t test.
DOI: http://dx.doi.org/10.7554/eLife.24241.017


