
Figure 1. Nm4302 Mutations in Sh3tc2 and Nrcam.
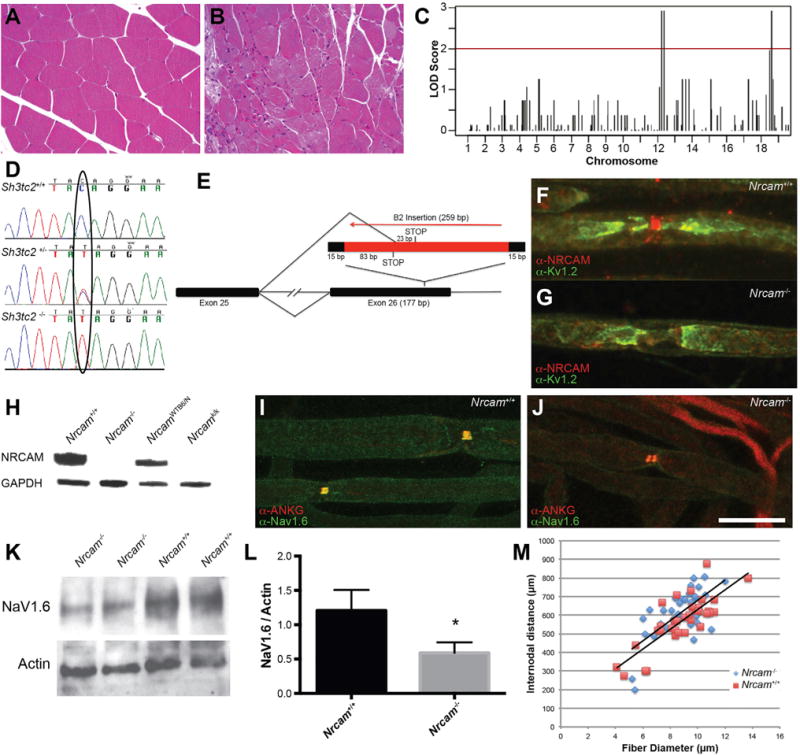
(A and B) Muscle histology from the gastrocnemius of control (A) and an affected Nm4302 mouse (B).
(C) Genetic mapping associations on both Chr12 and Chr18. The logarithm of the odds score (LOD, y axis) of SNPs is plotted versus their chromosomal location (x axis).
(D) Chromatograms of sequencing genomic DNA of a wild-type (top), Sh3tc2 heterozygote (middle), and Sh3tc2 homozygote (bottom) show the C to T conversion.
(E) The B2 element insertion in exon 26 of Nrcam results in a 259-bp insertion with a duplication of the flanking 15 bp of the exon. Splicing from exon 25 to 26 results in a premature stop codon in the B2 element sequence, and splicing into the B2 element itself results in a premature stop codon 23 bp downstream of the new splice junction.
(F and G) Immunolabeling of NRCAM (red) and KV1.2 (green) at nodes of Ranvier in teased sciatic nerve axons from wild-type mice (F) or Nrcam mutant mice (G) reveals an absence of signal in the mutant, confirmed in teased nerves from three mice per genotype.
(H) Western blotting protein from brain extracts revealed an absence of signal in Nrcam mutant mice (Nrcam−/−). Mice from the KOMP2 program carrying an Nrcam mutation (Nrcamk/k) and a strain-matched littermate control (NrcamWTB6/N) were used as controls. Wild-type littermates from each Nrcam mutant strain contain protein at the predicted size, and anti-GAPDH was used as a loading control (below). Three independent blots were probed, and three mice per genotype were examined.
(I) Wild-type nodes of Ranvier have a single, colocalized site of NaV1.6 and ankyrinG immunoreactivity.
(J) In Nrcam mutant mice, nodes “split” with two sites of NaV1.6 and ankyrinG labeling. Four mice of each genotype were examined.
(K) Western blot of sciatic nerve lysates probed with antibodies against NaV1.6 revealed reduced signal relative to beta-actin loading control. Proteins migrated at their anticipated molecular weights of ~225 and ~42 kDa for NaV1.6 and beta-actin, respectively.
(L) Quantification of (K) revealed a 51% decrease in NaV1.6 intensity (three Nrcam−/− and three C57BL/6J control analyzed, p = 0.03), mean ± SD.
(M) The relationship between internodal distance and fiber diameter was not changed in Nrcam−/− mice compared to C57BL/6 controls (n = 3 mice per genotype, 37 Nrcam−/− and 34 Nrcam+/+ axons measured).
Scale bar in (J), 7 μm for (F) and (G) and 14 μm for (I) and (J).